For NinjaTrader futures traders who are tired of guessing
While Everyone Else Stares At Candlesticks, You'll Watch The Actual Fight Between Buyers And Sellers... Trade By Trade, Price By Price
Strategic Flows rebuilds every bar from the raw trades and runs 77 order flow signals through a Consensus engine that stays silent until the evidence agrees. One chart. One standard. No more talking yourself into trades.
WATCH: WELCOME TO STRATEGIC FLOWS
YES! I WANT STRATEGIC FLOWS →For NinjaTrader 8. One-time payment, not a subscription.
A Candlestick Shows You Four Prices.
The Order Flow Tells You The Story.
Here's what nobody tells you about the chart you stare at all day:
A candle shows you four prices. Open, high, low, close. That's it. It's a summary written AFTER the fight is over.
It doesn't show you the 2,400 contracts that sellers dumped into the low... that got absorbed without price moving a tick.
It doesn't show you that the "strong" breakout candle had almost nobody behind it.
It doesn't show you the trapped traders, the exhausted sellers, the iceberg orders quietly refilling at the same price, bar after bar.
The candle tells you WHAT happened. The order flow tells you WHO did it, WHERE they did it, and whether they won or got trapped.
That difference is the whole game.
I Learned Order Flow Where You Can't Fake It

MIKE VALTOS · FOUNDER, STRATEGIC FLOWS
My name is Mike Valtos.
I've spent over 30 years trading, first on the CME floor in the 1990s, then on institutional desks at JP Morgan, Commerzbank, Cargill and ED&F Man.
But the most important trading lesson I ever learned started before any of that, in a high school English class.
The Hamlet Problem
My teacher, Mr. White, assigned Hamlet. Bless him, he was my favorite high school teacher. And I did the work. I read it. Every page, every word, start to finish.
And when I closed the book, I could not have told you what the story was actually about.
I had read the words without taking them in context. And words without context aren't a story. They're just words.
It wasn't until college that the lights came on. I took a Literature course called Introduction to Shakespeare, and it required us to read more than the play. We had to read the analysis of the story too. There are thousands of books written about Hamlet. And working through what others saw in those same words taught me to read deeper into what Shakespeare wrote, to find the meaning underneath, and to put it all together to form my own thoughts on the story.
Same play I'd read in high school. Same words. A completely different experience. Because now I knew HOW to read them.
It is exactly the same with order flow.
Traders put a footprint chart on the screen and they can SEE the volume numbers. Every bid, every offer, right there. And they have no idea what any of it means. Because the numbers only become a story when you read them in context: how volume transacts on the bid versus the offer. Where an imbalance comes in. What delta is doing while it happens. Whether the volume behind it all is heavy or thin.
Once you know what you're looking at, the market tells you a story. Until then, you're a high school kid staring at Shakespeare.
That is why I created Strategic Flows: to help traders understand what is actually happening in the market. Not more numbers. The story.
I was lucky. I got my Introduction to Shakespeare for order flow in the one place where you couldn't avoid it.
A few years after graduating university, I went to work on the CME floor for Dean Witter Reynolds. And standing in the middle of it all, I didn't just see the order flow coming in and trading in the market. I started to understand how a big order from a certain participant can affect the market. Who was behind the volume told you as much as the volume itself.
On the floor, you didn't need a footprint chart. The footprint chart was standing all around you, shouting. You could SEE who was desperate. You could HEAR when the selling dried up.
When the pits died and the screens took over, all of that information didn't disappear. It just went invisible to anyone looking at candlesticks.
I've spent the last two decades building tools that put that floor information back on the screen. Tens of thousands of traders have used my order flow software and training.
And then last year, something happened that changed everything.
The Rebuild That Showed Me What I'd Been Missing
My team and I tore a footprint engine down to zero and rebuilt it piece by piece. Every trade, every bid, every offer, reassembled by hand.
And in that process, staring at the raw prints at the most granular level possible, I started noticing order flow patterns I had never consciously named in 30 years of trading.
Patterns like a single lonely imbalance one tick under the high of a bar, with no followers. Like the bar's heaviest volume landing exactly on the floor of its own value area. Like one side's prints growing louder at every price, the way bids used to grow louder in the pit.
Each one became a signal. Then another. Then another.
When we stopped, we had 77 of them. And a problem.
77 Signals Is Useless.
Here's What Isn't.
Let me be blunt about something most software vendors will never say:
More signals do not make you money. More signals make you confused.
Every trader already knows the honest answer to "should I take a trade on one signal?" It's no. And yet in the moment, with price moving and adrenaline up, one strong-looking signal is exactly what we talk ourselves into.
So we built something I've never seen in any footprint software at any price:
The Consensus Engine
Think of every signal you enable as a witness. One witness can be wrong. But when several witnesses who never spoke to each other tell the same story, you listen.
Turn on Consensus and your chart goes quiet. Nothing prints until at least N of your chosen signals agree, same bar, same direction. You set the standard. The software enforces it on every single bar, including the ones where you're tired, in a drawdown, or chasing.
Consensus Groups goes further: demand evidence of two DIFFERENT kinds before anything prints. Absorption signals in Group A. Initiative signals in Group B. Two thermometers agreeing is one measurement taken twice. A fever plus a blood test is a diagnosis.
Swing Flex anchors the whole case to market structure, so the evidence has to stack up at the turn, not in the middle of nowhere.
Your discipline stops living in your willpower and starts living in your software.
That is what separates Strategic Flows from every other footprint tool on the market. Everyone else sells you instruments. This is the first one that comes with a conductor.
Everything You Get Inside Strategic Flows
- See who's winning the fight inside every bar instead of guessing from a candle's shape, so you stop taking trades against the side with the deeper pockets
- 77 battle-tested order flow signals working for you on every single bar, so you catch the absorption, exhaustion and trapped traders your eyes would miss even after 10,000 hours of screen time
- The Consensus engine stays silent until YOUR evidence agrees, so you physically cannot talk yourself into a garbage trade at 2pm because one pretty arrow showed up
- Build your own indicator from 665,000+ possible setups without writing a line of code, so your chart trades YOUR read of the market, not some vendor's
- Consensus Groups demands two different KINDS of proof before it speaks, so you never again mistake four versions of the same observation for confirmation
- Swing Flex anchors your signals to actual turning points, so you're buying where the move starts, not in the middle of nowhere
- Signals fire live on the forming bar, not after the close, so you're acting while the opportunity still exists instead of admiring it in hindsight
- The news calendar prints on your chart DAYS ahead with shading around every release, so you never donate your morning's profit to a CPI number you forgot about
- The bar countdown tells you exactly how much bar is left on ANY chart type, so you make your decision on a closed bar like a professional, not on a half-finished one like a gambler
- The Price Line shows who's aggressive THIS second and your distance to the level that matters, so your final go/no-go takes one glance, not one more indicator
- 5 ready-made Templates get you trading a proven layout in two clicks, so you're productive the first hour you install it, not three weekends of settings later
- The entire platform lives in one on-chart toolbar, so you change anything mid-session in one click and your eyes never leave the market
- Flip any filter and your whole chart history re-draws instantly, so the software teaches you what works before you risk a single dollar on it
- Every one of the 77 signals is BloodHound-readable, so the moment you trust your standard, you can automate it
- A plain-English User Guide and Cheat Sheet explain every signal like you're new, so you're never paying for features you don't understand how to use
- One-time payment, not a subscription, so it stops costing you money the day you buy it instead of every month forever
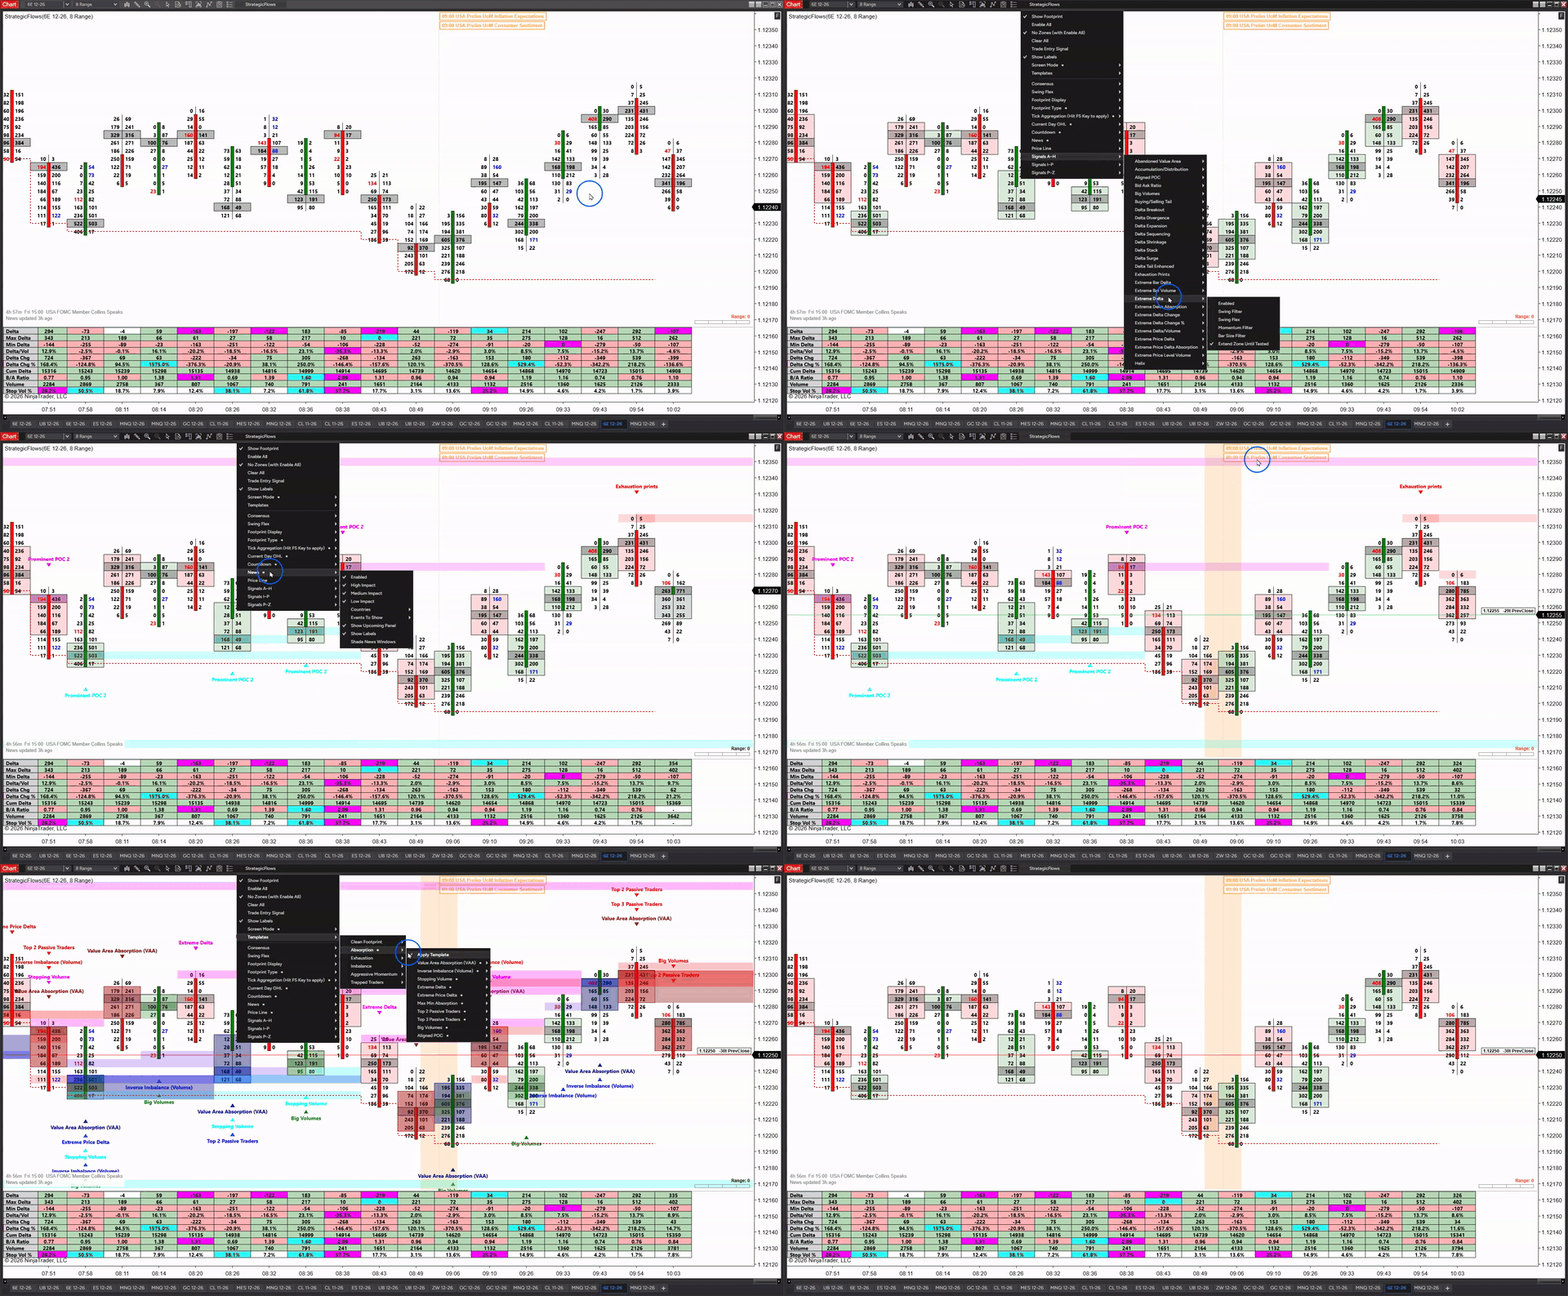
STRATEGIC FLOWS LIVE: EVERY BID, EVERY OFFER, EVERY BAR, REBUILT FROM THE RAW TRADES AS THEY HAPPEN
The 77 Signals, Grouped By What The Market Is Actually Doing
Every signal watches one kind of behavior. Here are the seven families, in plain English:
Delta: Who's In A Hurry
Delta is aggressive buying minus aggressive selling, the running score of the fight. These signals catch the score exploding, multiplying bar over bar, snowballing across four bars, or quietly dying right at the high of day. And the most dangerous moment in trading: when price makes a new low but the MONEY was net buying. Price and delta disagreeing at an extreme is how turns announce themselves.
Absorption: Punching A Mattress
Absorption is one side pressing hard while price refuses to move their way. Sellers unload thousands of contracts into a level and the market just... eats them. All that effort soaked up by patient orders on the other side. These signals catch the punches as they land: delta pinned at its worst reading while the bar closes up, heavy volume parked at the exact prices the market then rejected, a quarter of the bar's business done at the two levels price refused to stay at. When the aggressive side can't move price, the patient side has deeper pockets. That's who you want to trade with.
Imbalances: One Team Pulling A Rope Nobody's Holding
An imbalance is a price where one side overwhelmed the other 4 to 1. One is a data point. These signals read the groups: imbalances stacked price after price like a ladder (the classic institutional footprint), the same price getting hit two bars in a row (somebody reloading), and the trap setups, where sellers were maximally aggressive at the exact low that failed, and every one of those contracts is now underwater. Trapped traders have to get out. Their exits are your fuel.
POC: Where The Real Business Was Done
The POC is the busiest price of the bar, the shelf where the most volume changed hands. These signals track where that shelf sits and how it moves: a POC stepping higher three bars in a row means acceptance itself is relocating, not just price probing. A POC buried below the previous bar's low on an up close means the market probed deep, did its biggest business down there, and the buyers won it. Price lies. Volume concentration doesn't.
Value Area: What The Market Agreed Was Fair
The value area is the band holding most of the bar's business, the zone where buyers and sellers roughly agreed. These signals catch the agreement breaking: a whole value area abandoned so fast the next bar never touches it, value forming entirely inside a rejection wick, a gap of empty prices between one bar's value and the next. When the market's definition of "fair" jumps, the empty space it left behind becomes your map.
Volume Prints & Liquidity: The Walls And The Vacuums
The raw prints themselves. Walls of size stacked across consecutive prices where somebody large is camped. Iceberg orders refilling at the same price bar after bar. The bar's three heaviest prints all sitting on the patient side of the move, which means the biggest money was absorbing, not chasing. And the vacuums: prices the market skipped so fast one side never got filled, which it has a habit of coming back for.
Exhaustion & Auction: The Tank Hitting Empty
Moves rarely end because the other side attacks. They end because the fuel runs out. These signals read the gauge: almost no selling left at the new low, zero prints where one whole side refused to participate, the last price of a move trading thirty times less volume than the price before it. Plus the auction's unfinished business, extremes the market left mid-sentence and tends to come back and complete.
Every signal is tagged Reversal, Momentum, Confirmation or Support/Resistance, so you always know what kind of message it's sending. And the Cheat Sheet tells you which ones overlap and which ones stack into a real case.
The Signal Library
77 Signals. Every One
Tells You What Job It Does.
Each signal is tagged with one of four jobs, so you always know what kind of message it's sending. Every signal has a bullish form and a mirrored bearish form. Click a family below to see only its signals.
MOMENTUMAbandoned Value Area
Next bar never returns to value. Often at the start of big moves.
Value AreaCONFIRMATIONAccumulation/Distribution
The winning side owns the busiest price.
Volume / LiquiditySUP/RESAligned POC
The busiest shelf holds for two bars. A level the market agreed on.
POCCONFIRMATIONBid Ask Ratio
One side out-trading the other across the entire bar.
Exhaustion / AuctionSUP/RESBig Volumes
Both sides' heaviest prints meeting at one junction price.
Volume / LiquidityREVERSALBuying/Selling Tail
Two clean zeros at the extreme. Textbook rejection.
Volume / LiquidityMOMENTUMDelta Breakout
Aggressive money building across two bars in a row.
DeltaREVERSALDelta Divergence
A new session low made on net BUYING.
DeltaREVERSALDelta Expansion
One-sided from the first tick, no give-back. A clean takeover.
DeltaREVERSALDelta Sequencing
Somebody doubling down into the floor, and losing.
DeltaREVERSALDelta Shrinkage
A tiny delta right at the day's extreme. The tank reading empty.
DeltaCONFIRMATIONDelta Stack
Heavy counter-selling at multiple prices, eaten by the close.
DeltaMOMENTUMDelta Surge
A four-bar snowball off a flip, each push stronger.
DeltaREVERSALDelta Tail Enhanced
All the selling quarantined to the very bottom of an up bar.
DeltaREVERSALExhaustion Prints
The selling fuel gone at the new low. The field's namesake signal.
Exhaustion / AuctionMOMENTUMExtreme Bar Delta
One side didn't just win the bar, it steamrolled it.
DeltaCONFIRMATIONExtreme Bar Volume
The crowd showed up.
Volume / LiquidityMOMENTUMExtreme Delta
The final delta pinned at its most one-sided reading. No fade into the close.
AbsorptionCONFIRMATIONExtreme Delta Absorption
Sellers pressed the whole bar. The market ate every contract.
AbsorptionMOMENTUMExtreme Delta Change % Threshold
Pressure multiplying. The quiet-to-loud transition.
DeltaMOMENTUMExtreme Delta Change Threshold
Pressure jumping hard from one bar to the next.
DeltaCONFIRMATIONExtreme Delta/Volume Threshold
Volume that mostly points one way. Purity of the push.
DeltaMOMENTUMExtreme Price Delta
Single prices where one side dumped outsized aggression.
AbsorptionCONFIRMATIONExtreme Price Delta Absorption
Heavy sellers trapped at exact addresses inside a rising bar.
AbsorptionSUP/RESExtreme Price Level Volume
Single prices with landmark business. Levels that get remembered.
Volume / LiquidityCONFIRMATIONHelix
Both sides ramping together off the extreme. A healthy engine.
Volume / LiquidityMOMENTUMImbalance Auction
Advertise, test, reclaim. The auction proving itself.
ImbalanceCONFIRMATIONImbalance Bumper
Both rails bumped in the same bar. The close names the winner.
ImbalanceMOMENTUMImbalance Counts
Your minimum crowd of one-sided wins before the bar earns a mark.
ImbalanceREVERSALImbalance Deserts
One lone counterpunch at the edge with no followers.
ImbalanceMOMENTUMImbalance Reload
The same price hit two bars running. A campaign refilling.
ImbalanceREVERSALImbalance Reversal
Maximum aggression at the exact extreme that failed.
ImbalanceSUP/RESImbalance Sandwich
Both armies aggressive in one bar. Its edges become battle lines.
ImbalanceMOMENTUMInitiative Imbalances
Buyers paying up beyond what the bar itself called fair.
ImbalanceCONFIRMATIONInverse Imbalance
Counter-aggression that lost. Fuel for the move.
ImbalanceSUP/RESLow Volume Levels
The bar's single air pocket.
Volume / LiquidityMOMENTUMMarket Sweep Detector
Price moved so fast one side never got filled.
Volume / LiquidityREVERSALMarket Weakness
Three bars of shrinking pressure. An engine sputtering.
DeltaCONFIRMATIONMax Min Absorption
Price rose while buyers never chased. Quiet strength.
AbsorptionREVERSALMax Min Reversal
Their best punch landed, and price closed against them.
DeltaMOMENTUMMultiple Imbalances
Buyers winning fights all over the bar.
ImbalanceMOMENTUMOpen POC
The heaviest business done in brand-new territory.
POCREVERSALOrder Flow Ratio Bounds High
The move's last price traded almost nobody. Exhaustion as a single number.
Exhaustion / AuctionSUP/RESOrder Flow Ratio Bounds Low
The extreme defended with size. Price defense as a single number.
Exhaustion / AuctionMOMENTUMOrder Flow Sequencing
Buyers lifting bigger offers rung by rung up the ladder.
Volume / LiquidityCONFIRMATIONPOC Delta Line
Buyers above the busy price, sellers below it. An orderly bar.
POCMOMENTUMPOC Migration
Acceptance itself stepping higher three bars running, off a swing.
POCREVERSALPOC Reversal
The biggest business below the prior low, and it still closed up.
POCCONFIRMATIONPOC Shadows
Bought low, closed high.
POCREVERSALPOC Slingshot
Price pressed on while the business pulled back. The rubber band stretching.
POCREVERSALPOC Wave
The market's center of business traces a V.
POCREVERSALPrice Action Divergence
The candle says one thing, the money says another.
DeltaREVERSALProminent POC 1
The heaviest business right at the rejected extreme.
POCREVERSALProminent POC 2
The same tell, within ticks of the extreme.
POCREVERSALProminent POC 3
The widest net for prominent business near the extreme.
POCSUP/RESResting Liquidity
An iceberg refilling at the same price, bar after bar.
Volume / LiquidityREVERSALRetail Suck
The thinning ladder that tempts the crowd in right before the rug.
Volume / LiquidityCONFIRMATIONSmall Max Min Delta
The other side never laid a glove on the bar.
AbsorptionMOMENTUMStacked Imbalances
4-to-1 aggression marching price after price. The institutional footprint.
ImbalanceREVERSALStopping Volume
A quarter of the bar's business at the two rejected prices.
AbsorptionMOMENTUMStrong Prints
The bidding getting louder at every price.
Volume / LiquiditySUP/RESThin Print
Prices the market skipped. Vacuums that pull price back.
Volume / LiquidityCONFIRMATIONTop 2 Passive Traders
The same tell, built for short bars.
Volume / LiquidityCONFIRMATIONTop 3 Passive Traders
The bar's three biggest prints all on the patient side.
Volume / LiquidityCONFIRMATIONTrapped Aggressive Traders
A stacked run of sellers swallowed whole by an up close.
ImbalanceSUP/RESUnfinished Bars
Both ends unfinished. A double magnet.
Exhaustion / AuctionSUP/RESUnfinished Business
An extreme the auction left mid-sentence. A magnet until repaired.
Exhaustion / AuctionCONFIRMATIONValue Area Absorption
Sellers aggressive inside the zone of agreement. Price closed up anyway.
Value AreaMOMENTUMValue Area Engulfing
The new agreement swallows the old one whole.
Value AreaMOMENTUMValue Area Gaps
Fair value jumped and left a hole.
Value AreaREVERSALValue Area In Wick
All the real business left behind in the rejection wick.
Value AreaREVERSALValue Area Wicks Inverted
A red bar that closed above everything it agreed on. The color is lying.
Value AreaSUP/RESValue Support
The bar's heaviest price sitting on the floor of its own value.
Value AreaSUP/RESVertical Liquidity
A wall of size stacked across consecutive prices.
Volume / LiquidityMOMENTUMVolume Decline
Participation dying at the edge the move left behind.
Volume / LiquidityREVERSALVolume Dry Up
The crowd thinning as price stretches.
Volume / LiquidityCONFIRMATIONZero Print
Not low participation at the extreme. NO participation.
Volume / LiquidityAnd sitting above all of them: the Consensus signal itself, the black arrow that only prints when your chosen witnesses agree.
Order flow footprint software for NinjaTrader 8
Your Edge. Your Rules.
Your Own Indicator.
Stop trading someone else's signals. Build your own.
77 order flow signals. More than 665,000 setups you can build.* One rule: your evidence has to agree.
Strategic Flows doesn't hand you a black box. It hands you the building blocks, the rules and the discipline to turn YOUR read of the market into your own indicator.
Choose the signals you trust from the library above. Set how many of them must agree, in the same bar or across a short window. Anchor the whole case to a swing if location matters to you. From that moment on, your chart prints a trade only when they line up.
Maybe your read is "exhaustion at the low, confirmed by absorption." That's your indicator now. Maybe it's "stacked imbalances plus surging delta, with the trend only." Also your indicator. Two traders can run Strategic Flows side by side and end up with two completely different tools, because they built them from two different reads of the market. That isn't a feature of the software. That's the whole philosophy of it.
A Chart Full Of Arrows Is Not An Edge
Turn on a handful of ordinary indicators and your chart lights up all day. Arrows everywhere. Most of those arrows are context, not trades. But in the moment, with price moving and your finger on the trigger, one strong-looking signal is exactly what traders talk themselves into.
Most footprint software hands you someone else's signals and expects you to trade them. Strategic Flows takes the other approach: you decide what counts as evidence, and the software holds you to it on every bar. Including the bars where you're tired. Including the week you're in a drawdown. Including the afternoon you're itching to chase a move you missed.
Your edge. Your rules. Your indicator. Enforced by the one participant at your desk with no emotions: the software.
*A conservative count. The two-, three- and four-signal combinations available to the Consensus engine alone come to more than 1.4 million; add Consensus Groups, the agreement window and the four per-signal filters, and the number of distinct setups you can define goes far beyond that.
Beyond The Signals: The Tools That Run The Chart
The signals are the witnesses. These are the judge, the courtroom and the clock.
Consensus & Consensus Groups: Your Discipline, Automated
Consensus has four modes, and together they're the reason this software exists:
- Threshold: "At least N of my signals must agree, same bar, same direction." You pick the signals, you pick the number. Bars that fall short stay blank. There's nothing on the chart to rationalize.
- Strict: every signal you enabled must agree, unanimously. Rare by design. Many traders save Strict for their A setup and set an alert on it.
- Window: real sequences aren't tidy. Stopping Volume prints on this bar, the stacked imbalance confirms on the next. Window lets your evidence spread across 2 or 3 bars and still count as one case, and the bar that completes it must contribute its own vote, so quiet bars never echo an old signal forward.
- Groups (Cross-Confirmation): here's the blind spot in every "confluence" approach: four absorption signals agreeing is ONE observation made four ways. Groups fixes it. Put your absorption signals in Group A, your initiative signals in Group B, give each a minimum, and nothing prints unless BOTH kinds of evidence show up. The fever AND the blood test, never two thermometers.
Here's what that actually looks like, on the same stretch of the same chart:
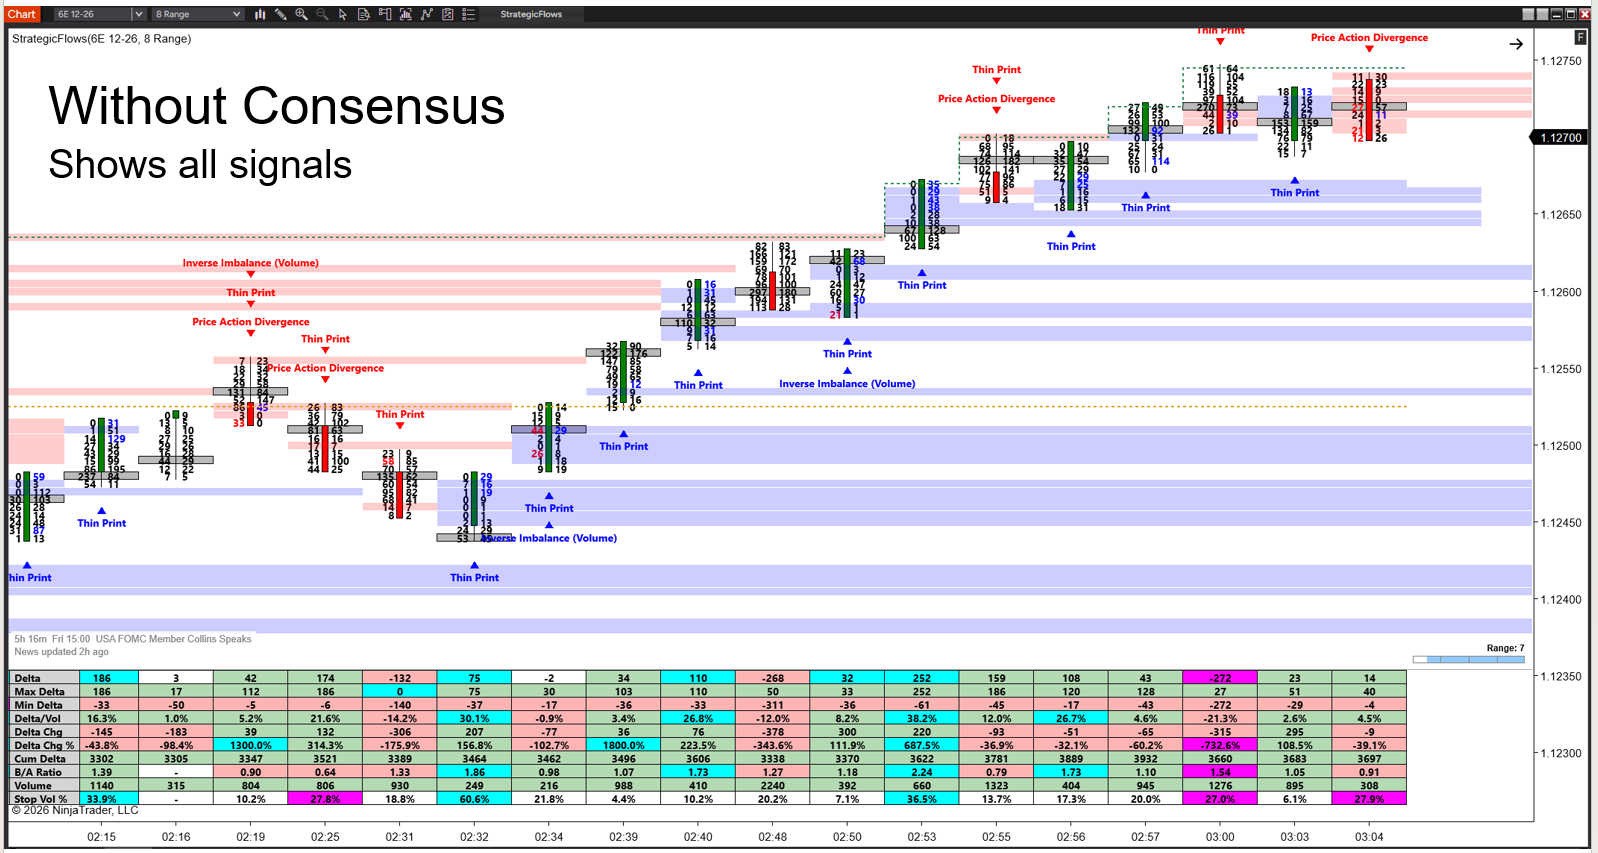
WITHOUT CONSENSUS: EVERY SIGNAL SPEAKS. ALL OF IT IS REAL INFORMATION, BUT IT'S CONTEXT, NOT A STANDARD
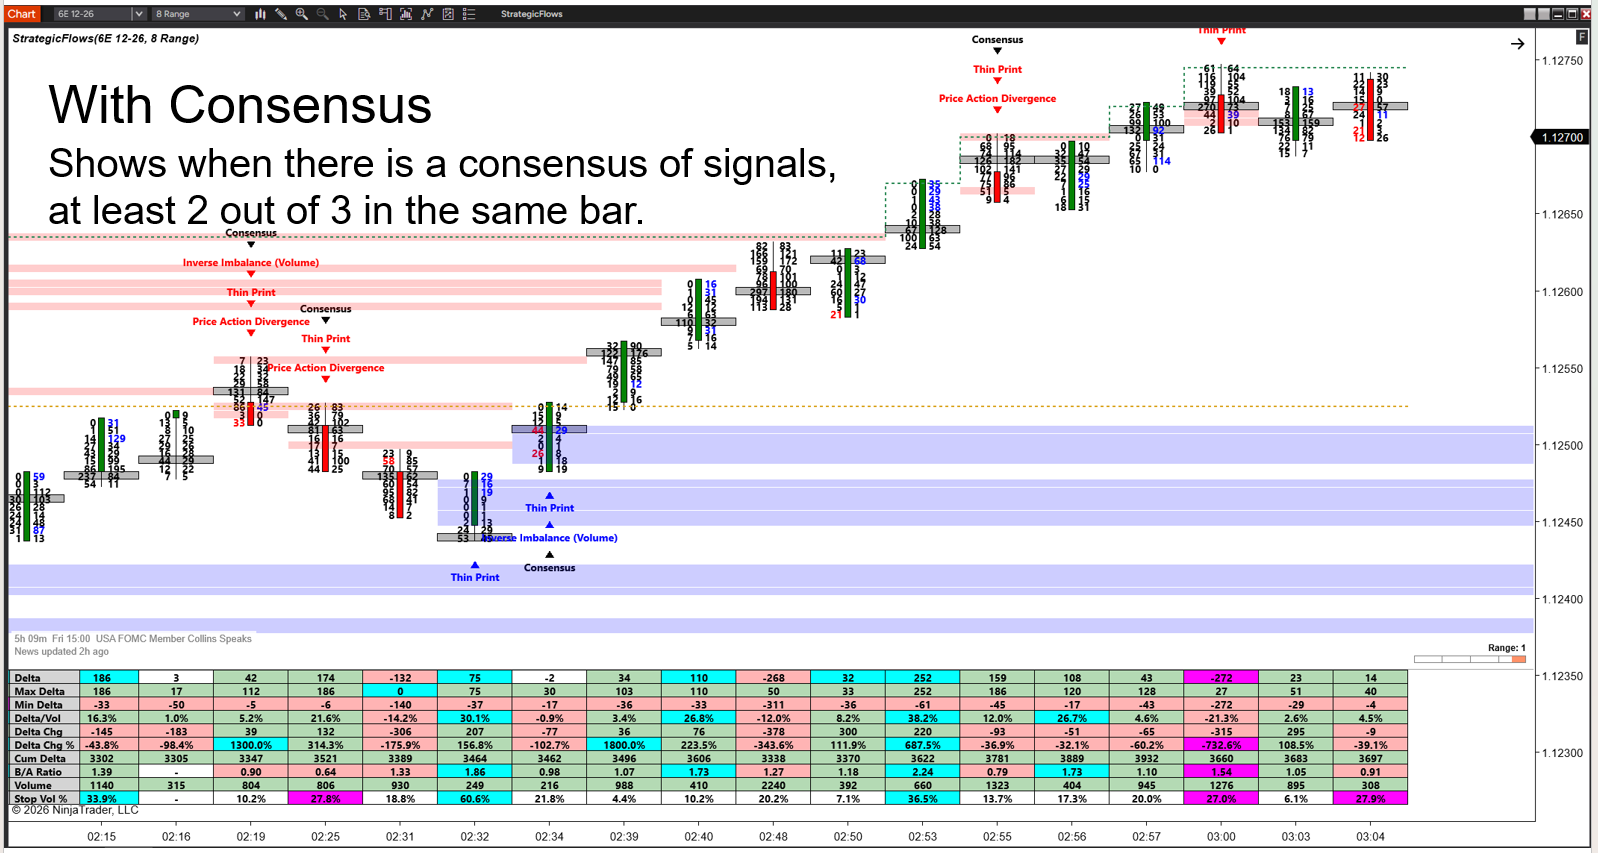
WITH CONSENSUS: SAME CHART, SAME SIGNALS, BUT NOW AT LEAST 2 OF 3 MUST AGREE IN THE SAME BAR BEFORE IT SPEAKS
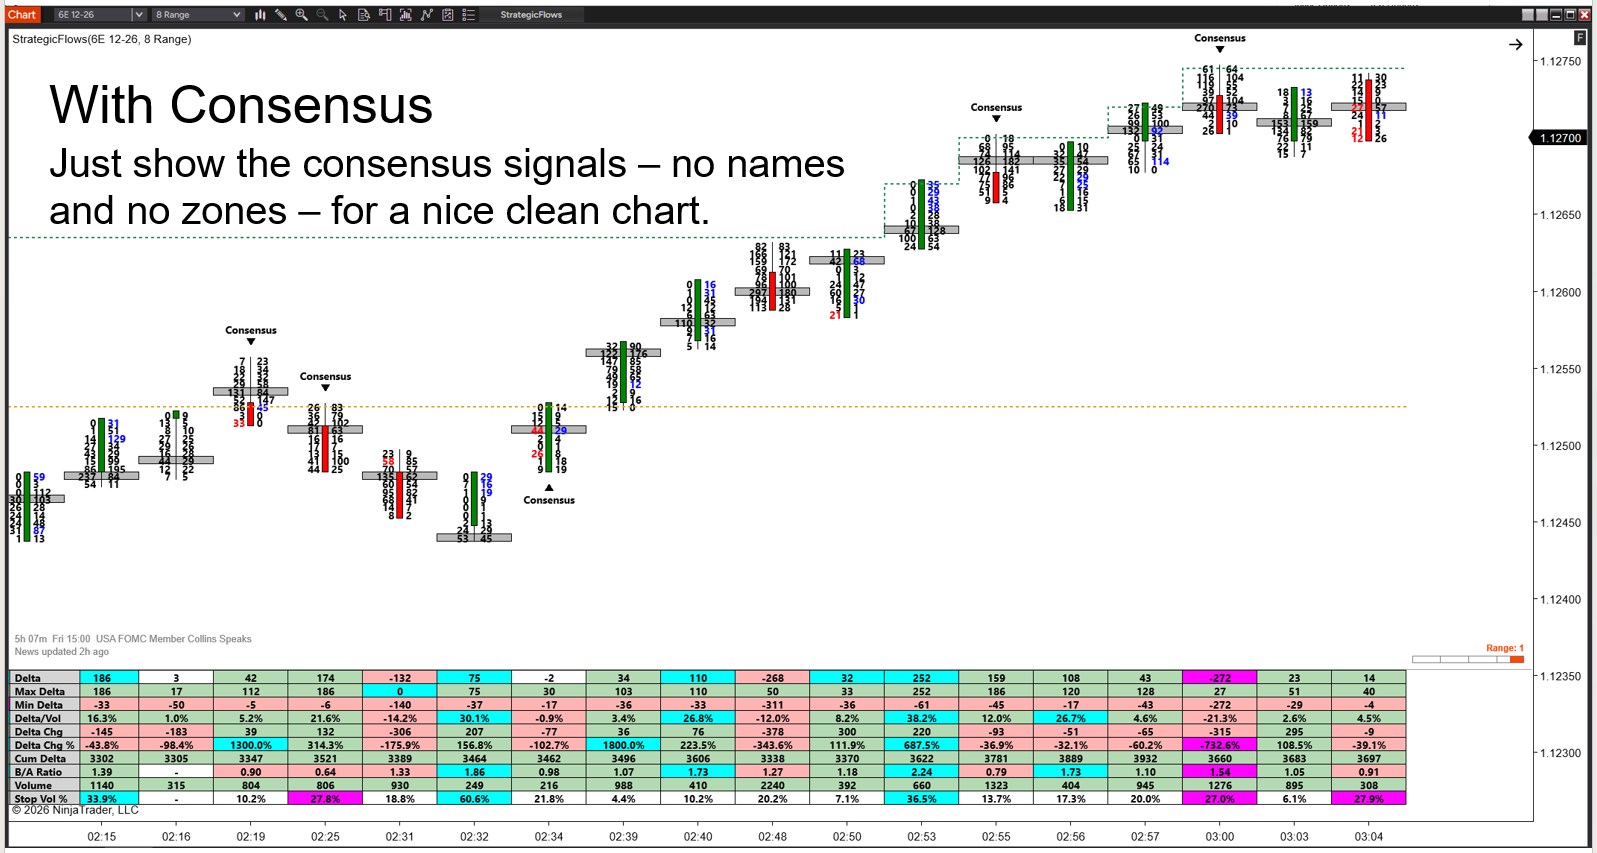
OR RUN IT CLEAN: JUST THE CONSENSUS MARKS, NO NAMES, NO ZONES. YOUR ENTIRE STANDARD IN ONE ARROW
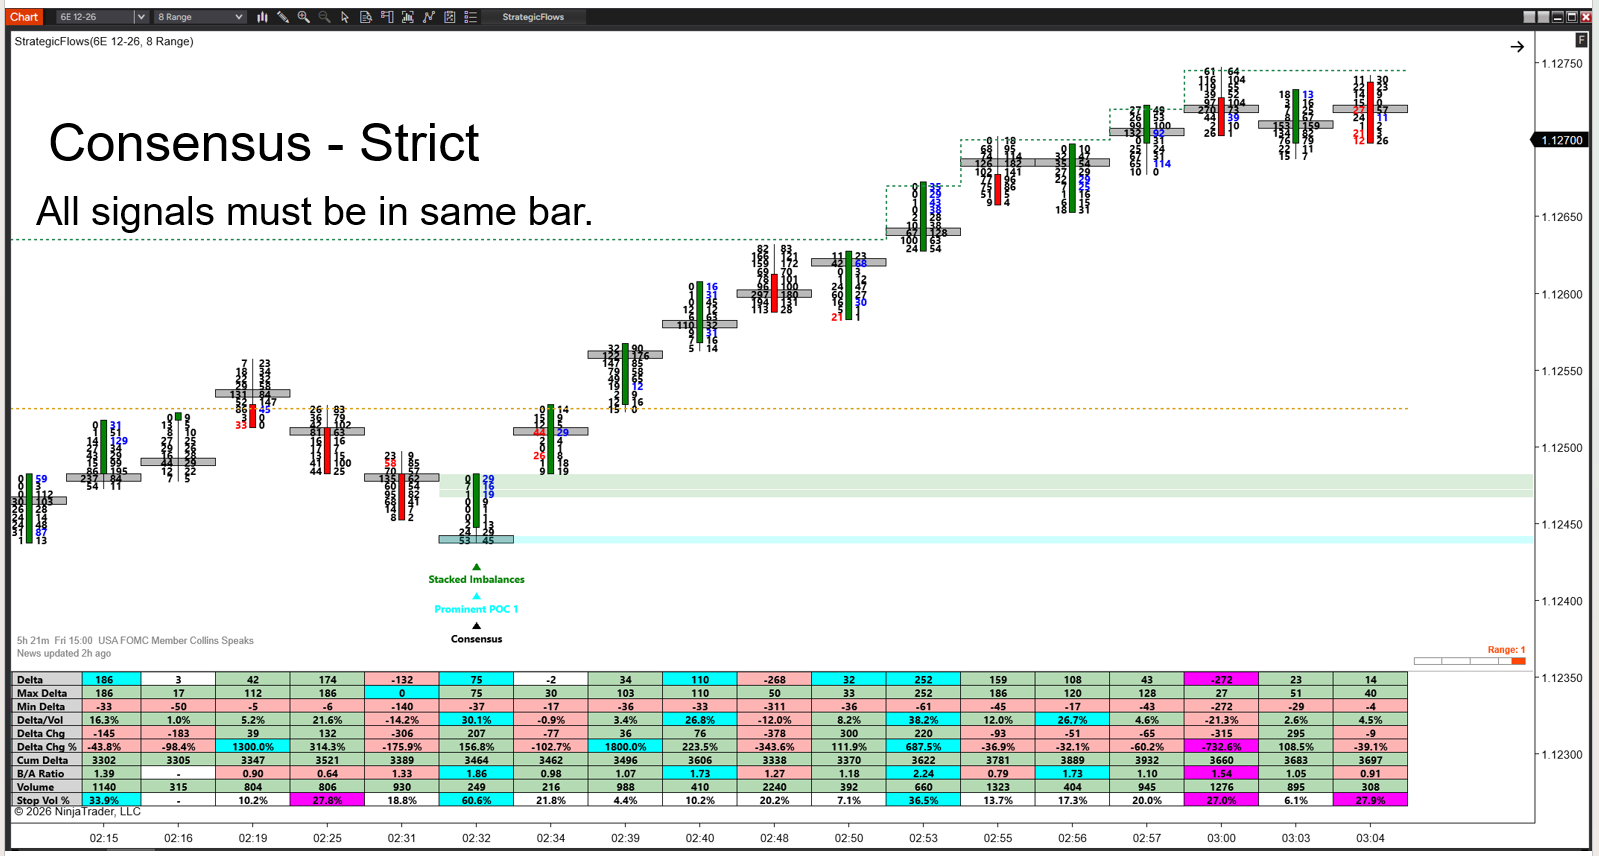
CONSENSUS STRICT: EVERY SIGNAL YOU ENABLED MUST AGREE IN THE SAME BAR. RARE BY DESIGN. THAT'S YOUR A SETUP
And the detail that makes Groups genuinely clean: member signals vote even when their chart display is off. So you can run a chart showing nothing but the Consensus arrow, and under each qualifying bar, Strategic Flows prints the names of the signals that made the case. You always know WHY the chart spoke.
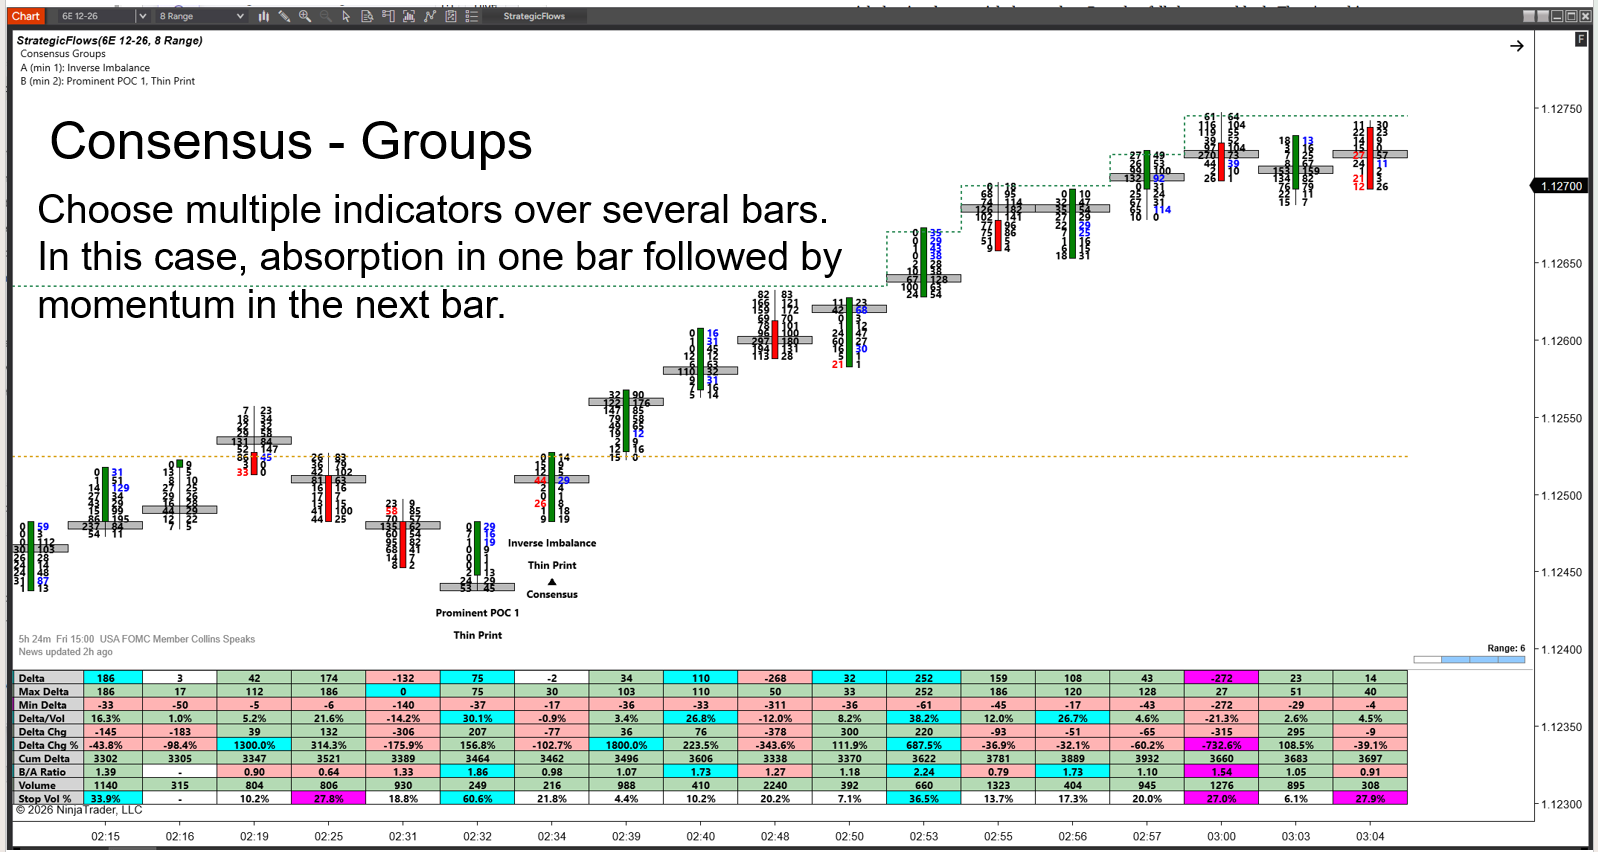
CONSENSUS GROUPS ACROSS BARS: ABSORPTION IN ONE BAR, MOMENTUM IN THE NEXT, AND THE WITNESSES NAMED RIGHT UNDER THE BAR
Swing Filter & Swing Flex: Location First, Then A Grace Period
The Swing Filter is a location filter. Turn it on for any signal and that signal only speaks at turning points: bullish only at swing lows, bearish only at swing highs. Fish hold near structure, not in open water, and so do good signals.
But markets are rarely punctual. The swing low prints, and the exhaustion you were waiting for arrives one bar later, while price is still sitting at the level. A strict filter rejects it for being late, like a bus door closing while you're on the top step.
Swing Flex holds the door. The swing is still required, but your signal may arrive up to 5 bars after it, per signal or across the board. And when Consensus is running, the swing becomes the anchor of the whole case: with "Require Signal On Swing Bar" on, at least one witness must have marked the turn itself. Evidence stacking up AT the turn is a different animal than agreement in the middle of nowhere, and no other footprint software even has a word for this.
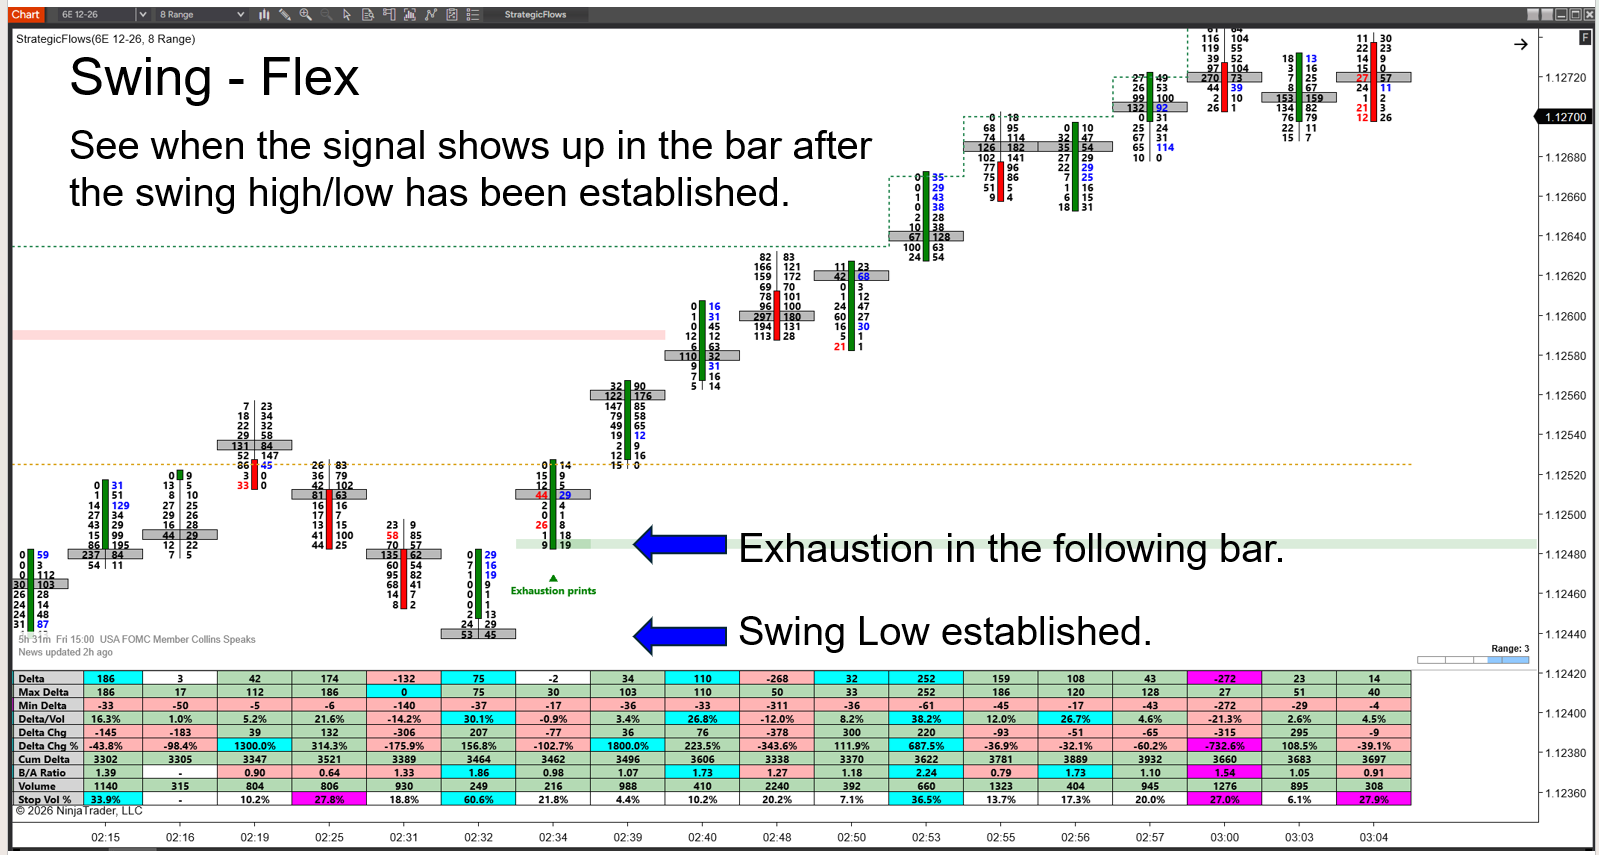
SWING FLEX IN ACTION: THE SWING LOW PRINTS, AND THE EXHAUSTION ARRIVES ON THE NEXT BAR. STILL COUNTS.
The Bar Countdown: Your Shot Clock
Every signal is judged on bars, and a bar isn't final until it closes. The countdown sits above your statistics panel showing exactly how much bar is left: time on minute charts, and on tick, volume and range bars, the trades, contracts or range still needed, which is the only clock those charts will ever have. At 80 percent complete it changes color; with Flash on, it blinks until the new bar opens. Read the signal when it prints. Decide when the clock runs out. On volume bars it's also a free participation gauge: a countdown draining fast means the crowd just showed up.
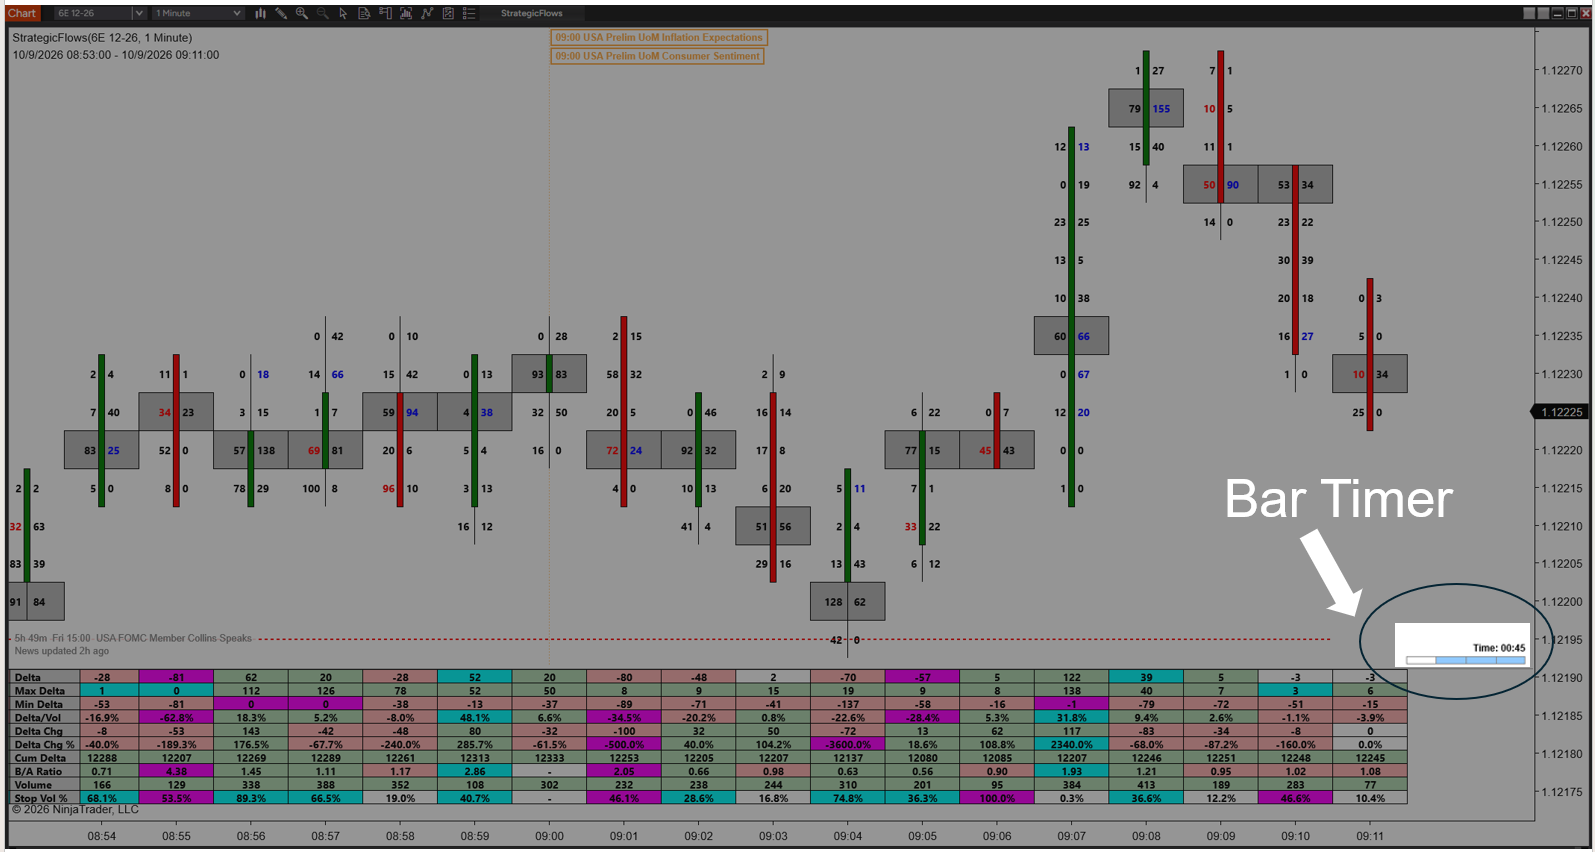
THE BAR TIMER: EXACTLY HOW MUCH BAR IS LEFT, ALWAYS IN THE SAME CORNER OF YOUR EYE
The Price Line: Who's Hitting Right Now
A live line at the last traded price, colored by aggression: green when the last trade lifted the offer, red when it hit the bid, updated trade by trade. Next to it, a label with your distance in ticks to the level that matters: prior close, session open, the session VWAP, or the developing POC. The countdown says the bar is about to close, the Price Line answers the final question: who is hitting RIGHT NOW? A buy signal with the line flashing green into the close and the same signal with the line solid red are not the same trade.
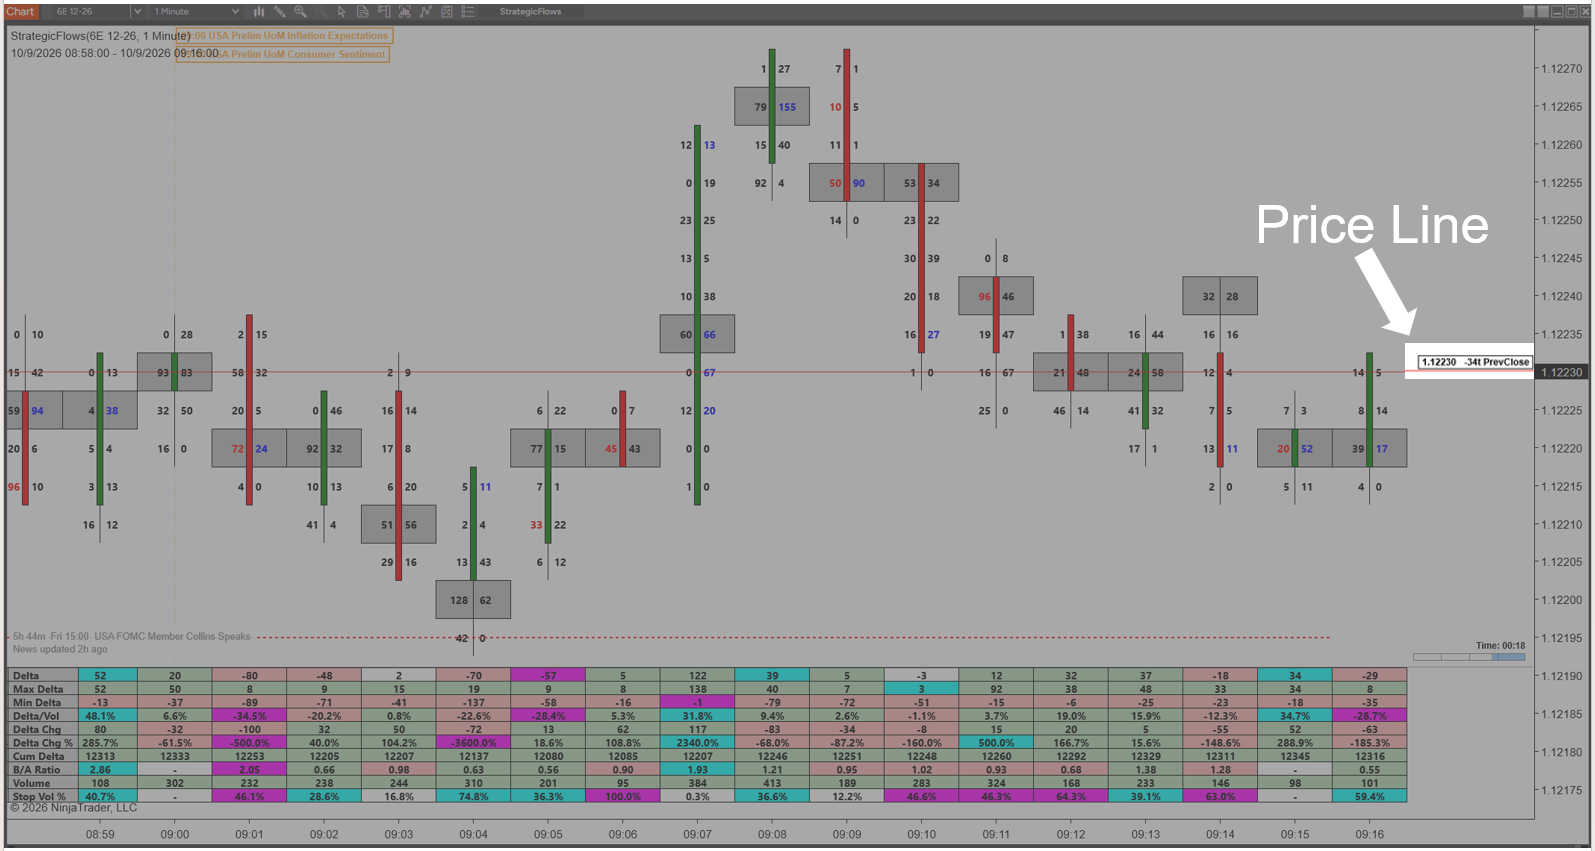
THE PRICE LINE: LAST PRICE, WHO'S AGGRESSIVE, AND YOUR DISTANCE TO THE LEVEL THAT MATTERS, 34 TICKS UNDER PRIOR CLOSE HERE
News Shading: Never Get Ambushed By A Release Again
Strategic Flows prints the economic calendar directly on your chart, ahead of time. Upcoming releases stand on the chart as marked lines with a countdown, days before they hit. And when an important number is minutes away, the chart shades the window around it, before, during and after the release, so you can see at a glance that you're inside news territory and stand aside while the market does its violent news thing.
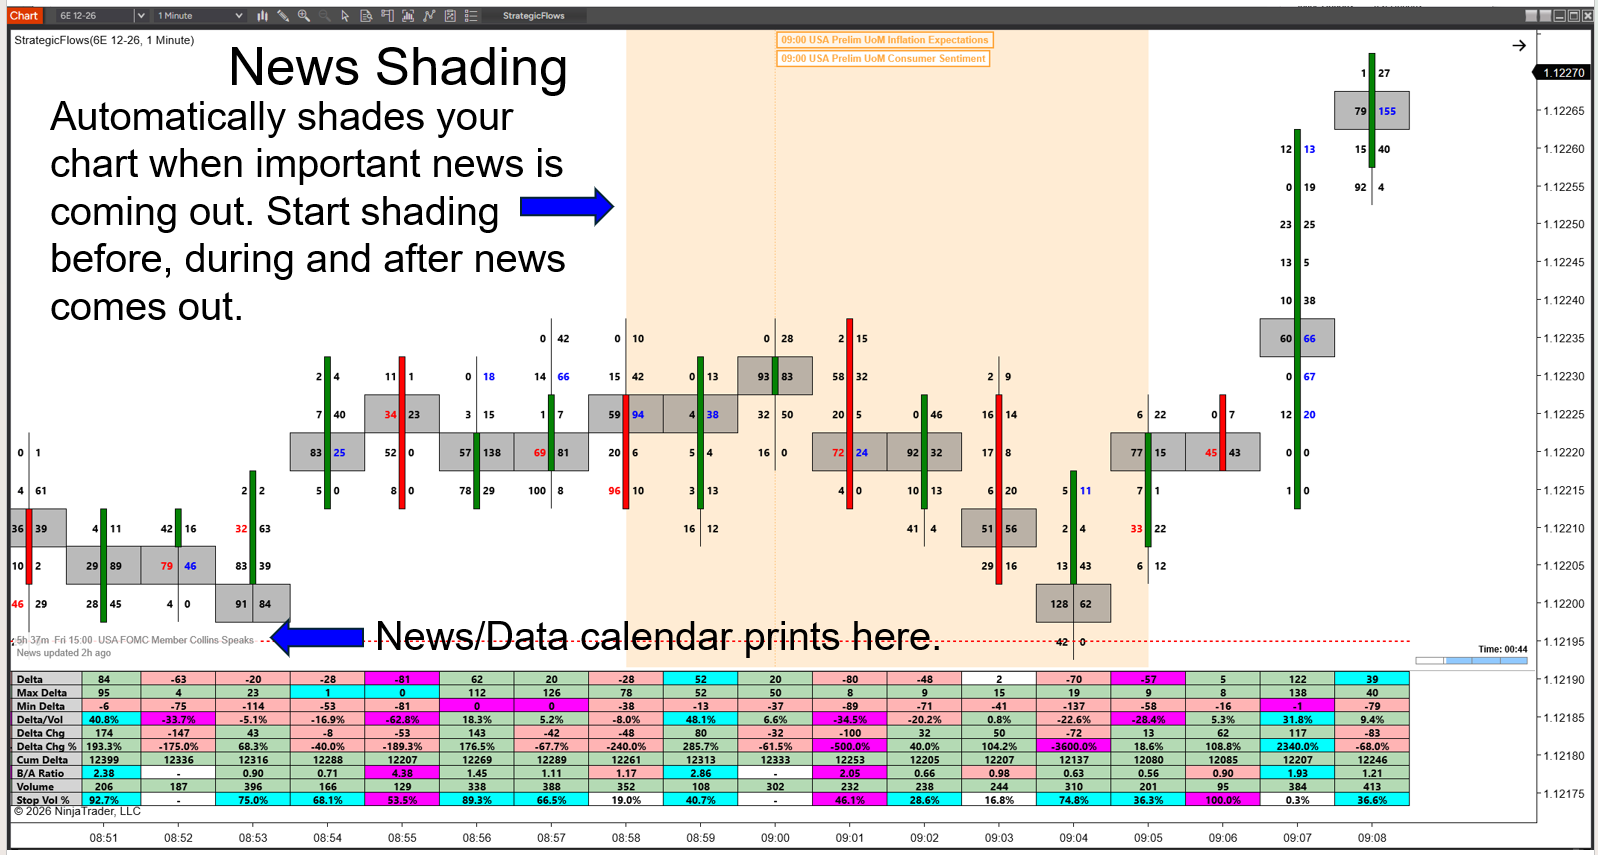
NEWS SHADING: THE CHART MARKS THE RELEASE WINDOW ITSELF, BEFORE, DURING AND AFTER THE NUMBER
The Trade Entry Signal: No Follow-Through, No Trade
This one is a game changer for order flow traders, and it's one checkbox.
Every order flow trader knows this pain: the signal was real, the read was right, and the trade still died, because nobody followed. The conditions were met on the signal bar, but the next bar never moved your way. Trade Entry Signal exists to keep you out of exactly those trades, the ones with no follow-through order flow.
Turn it on and a signal no longer prints the moment its conditions are met. The signal bar has to close, and the order flow in the following bar has to actually move in the direction of the trade, by the number of ticks you demand. Only then does the signal print, on the confirming bar. No follow-through? No signal. The trade that was going to stop you out never even reached your chart.
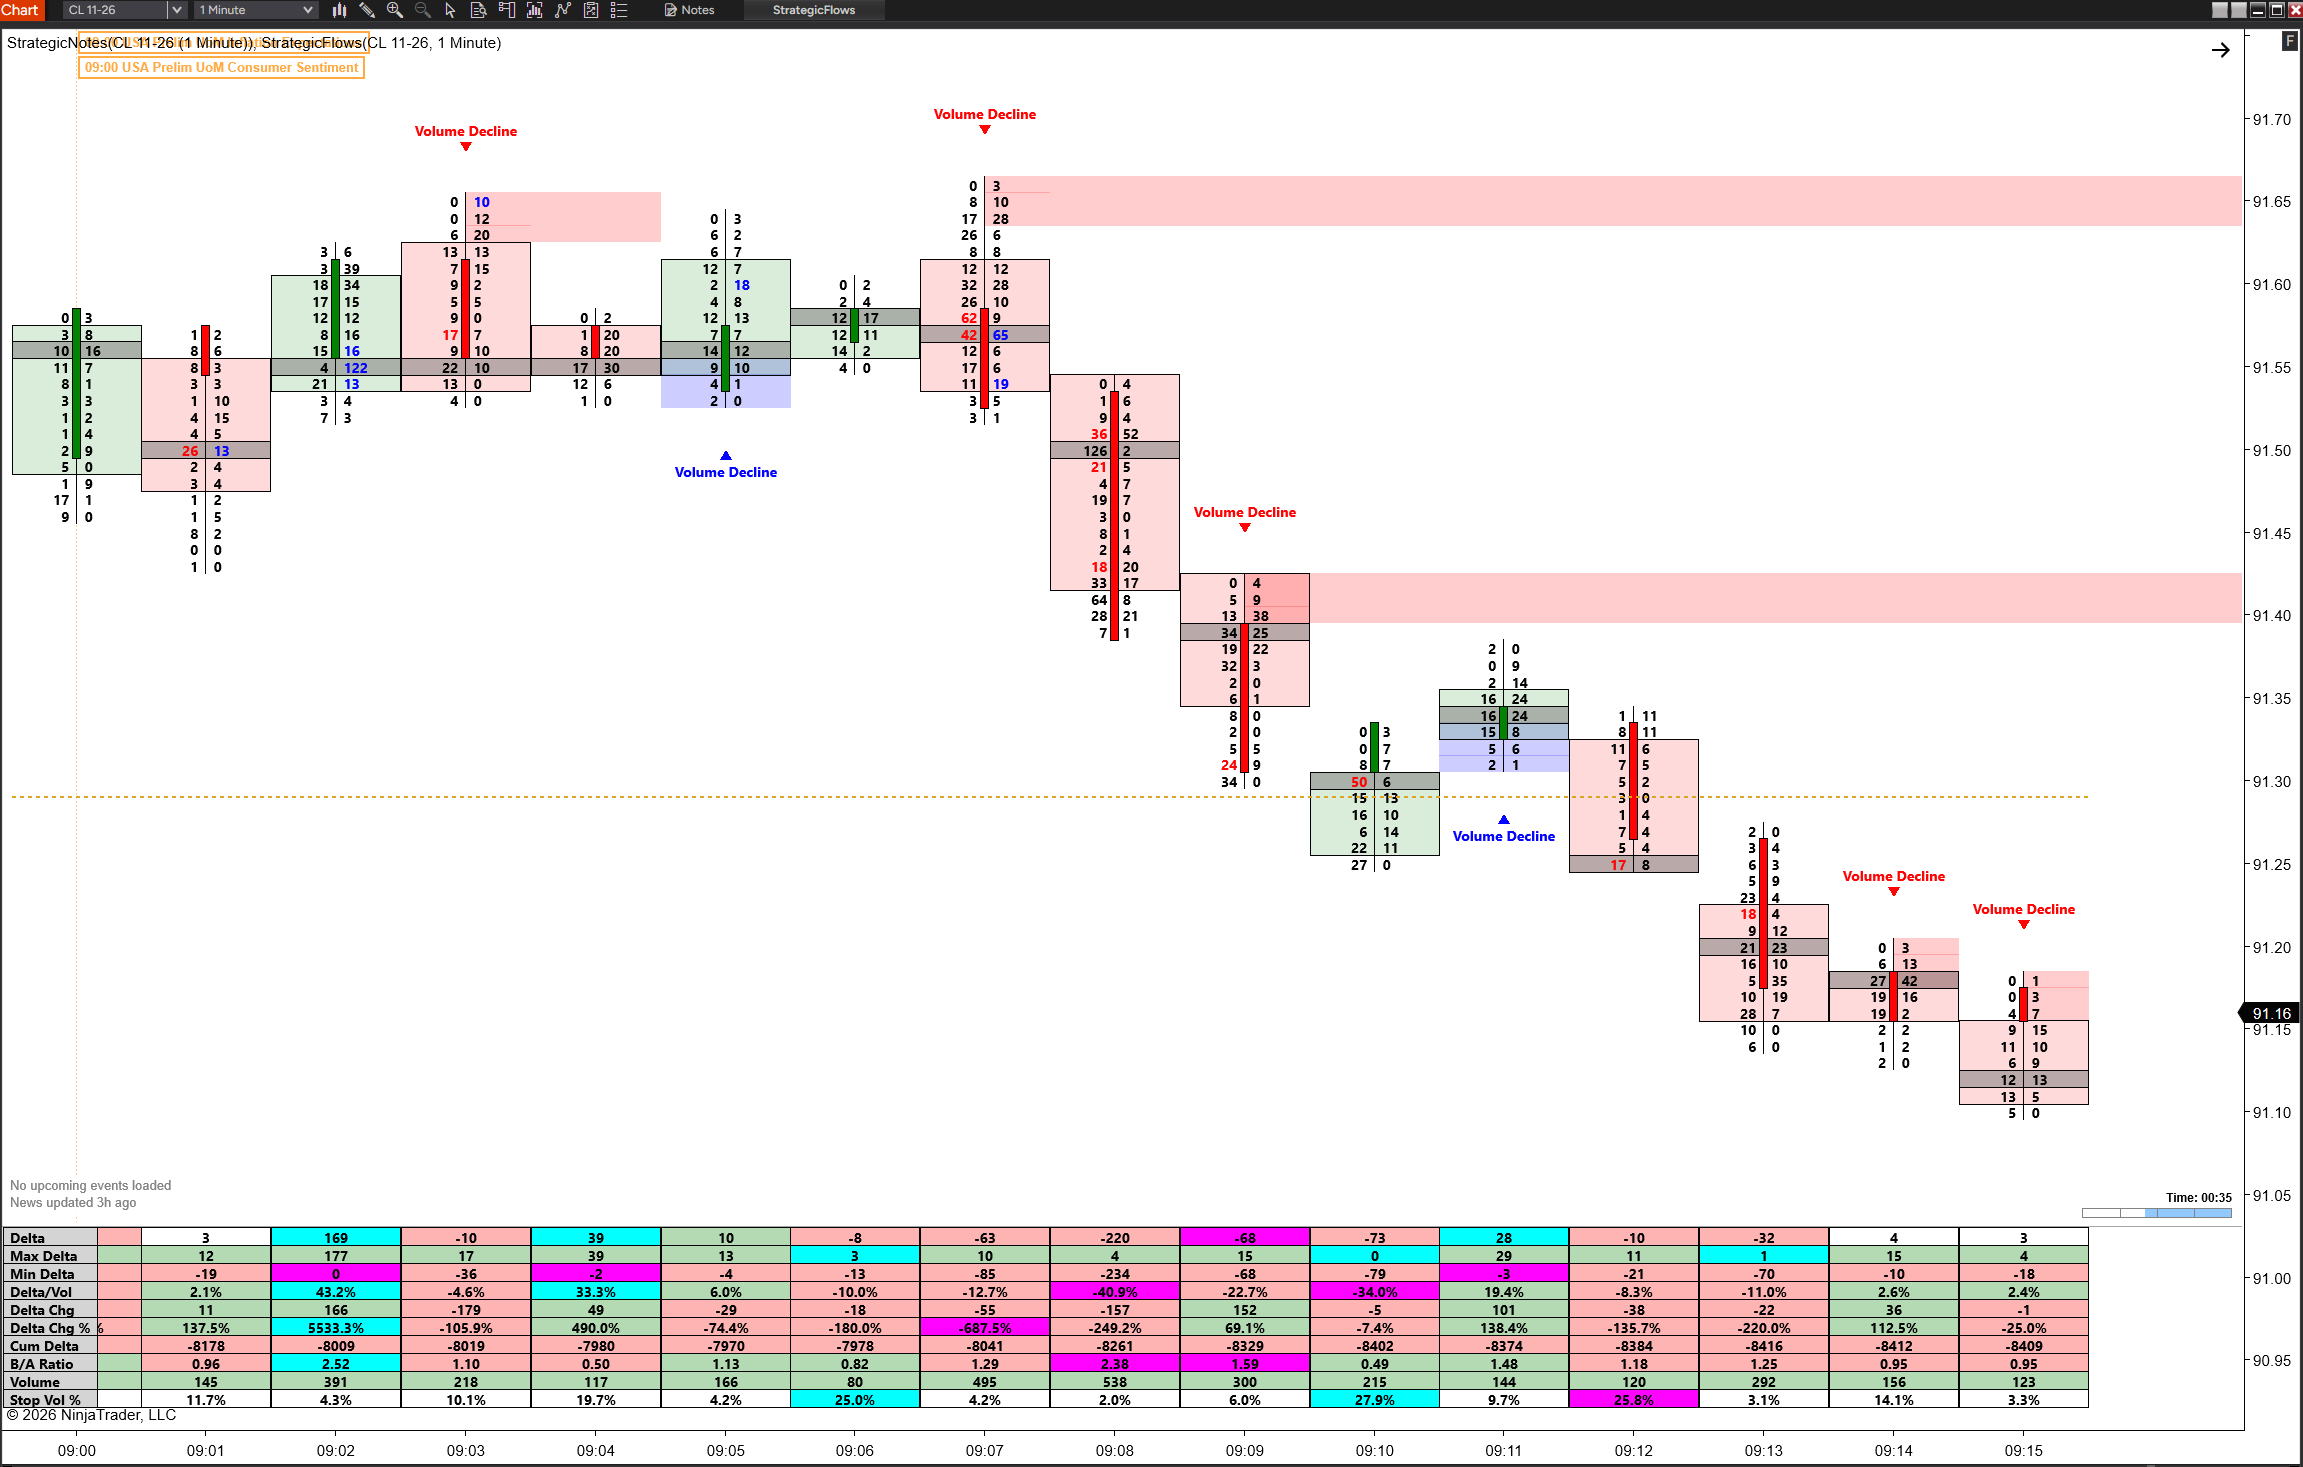
TRADE ENTRY SIGNAL OFF: SEVEN SIGNALS IN FIFTEEN MINUTES, INCLUDING TWO BUYS INTO A FALLING MARKET THAT NEVER GOT FOLLOW-THROUGH
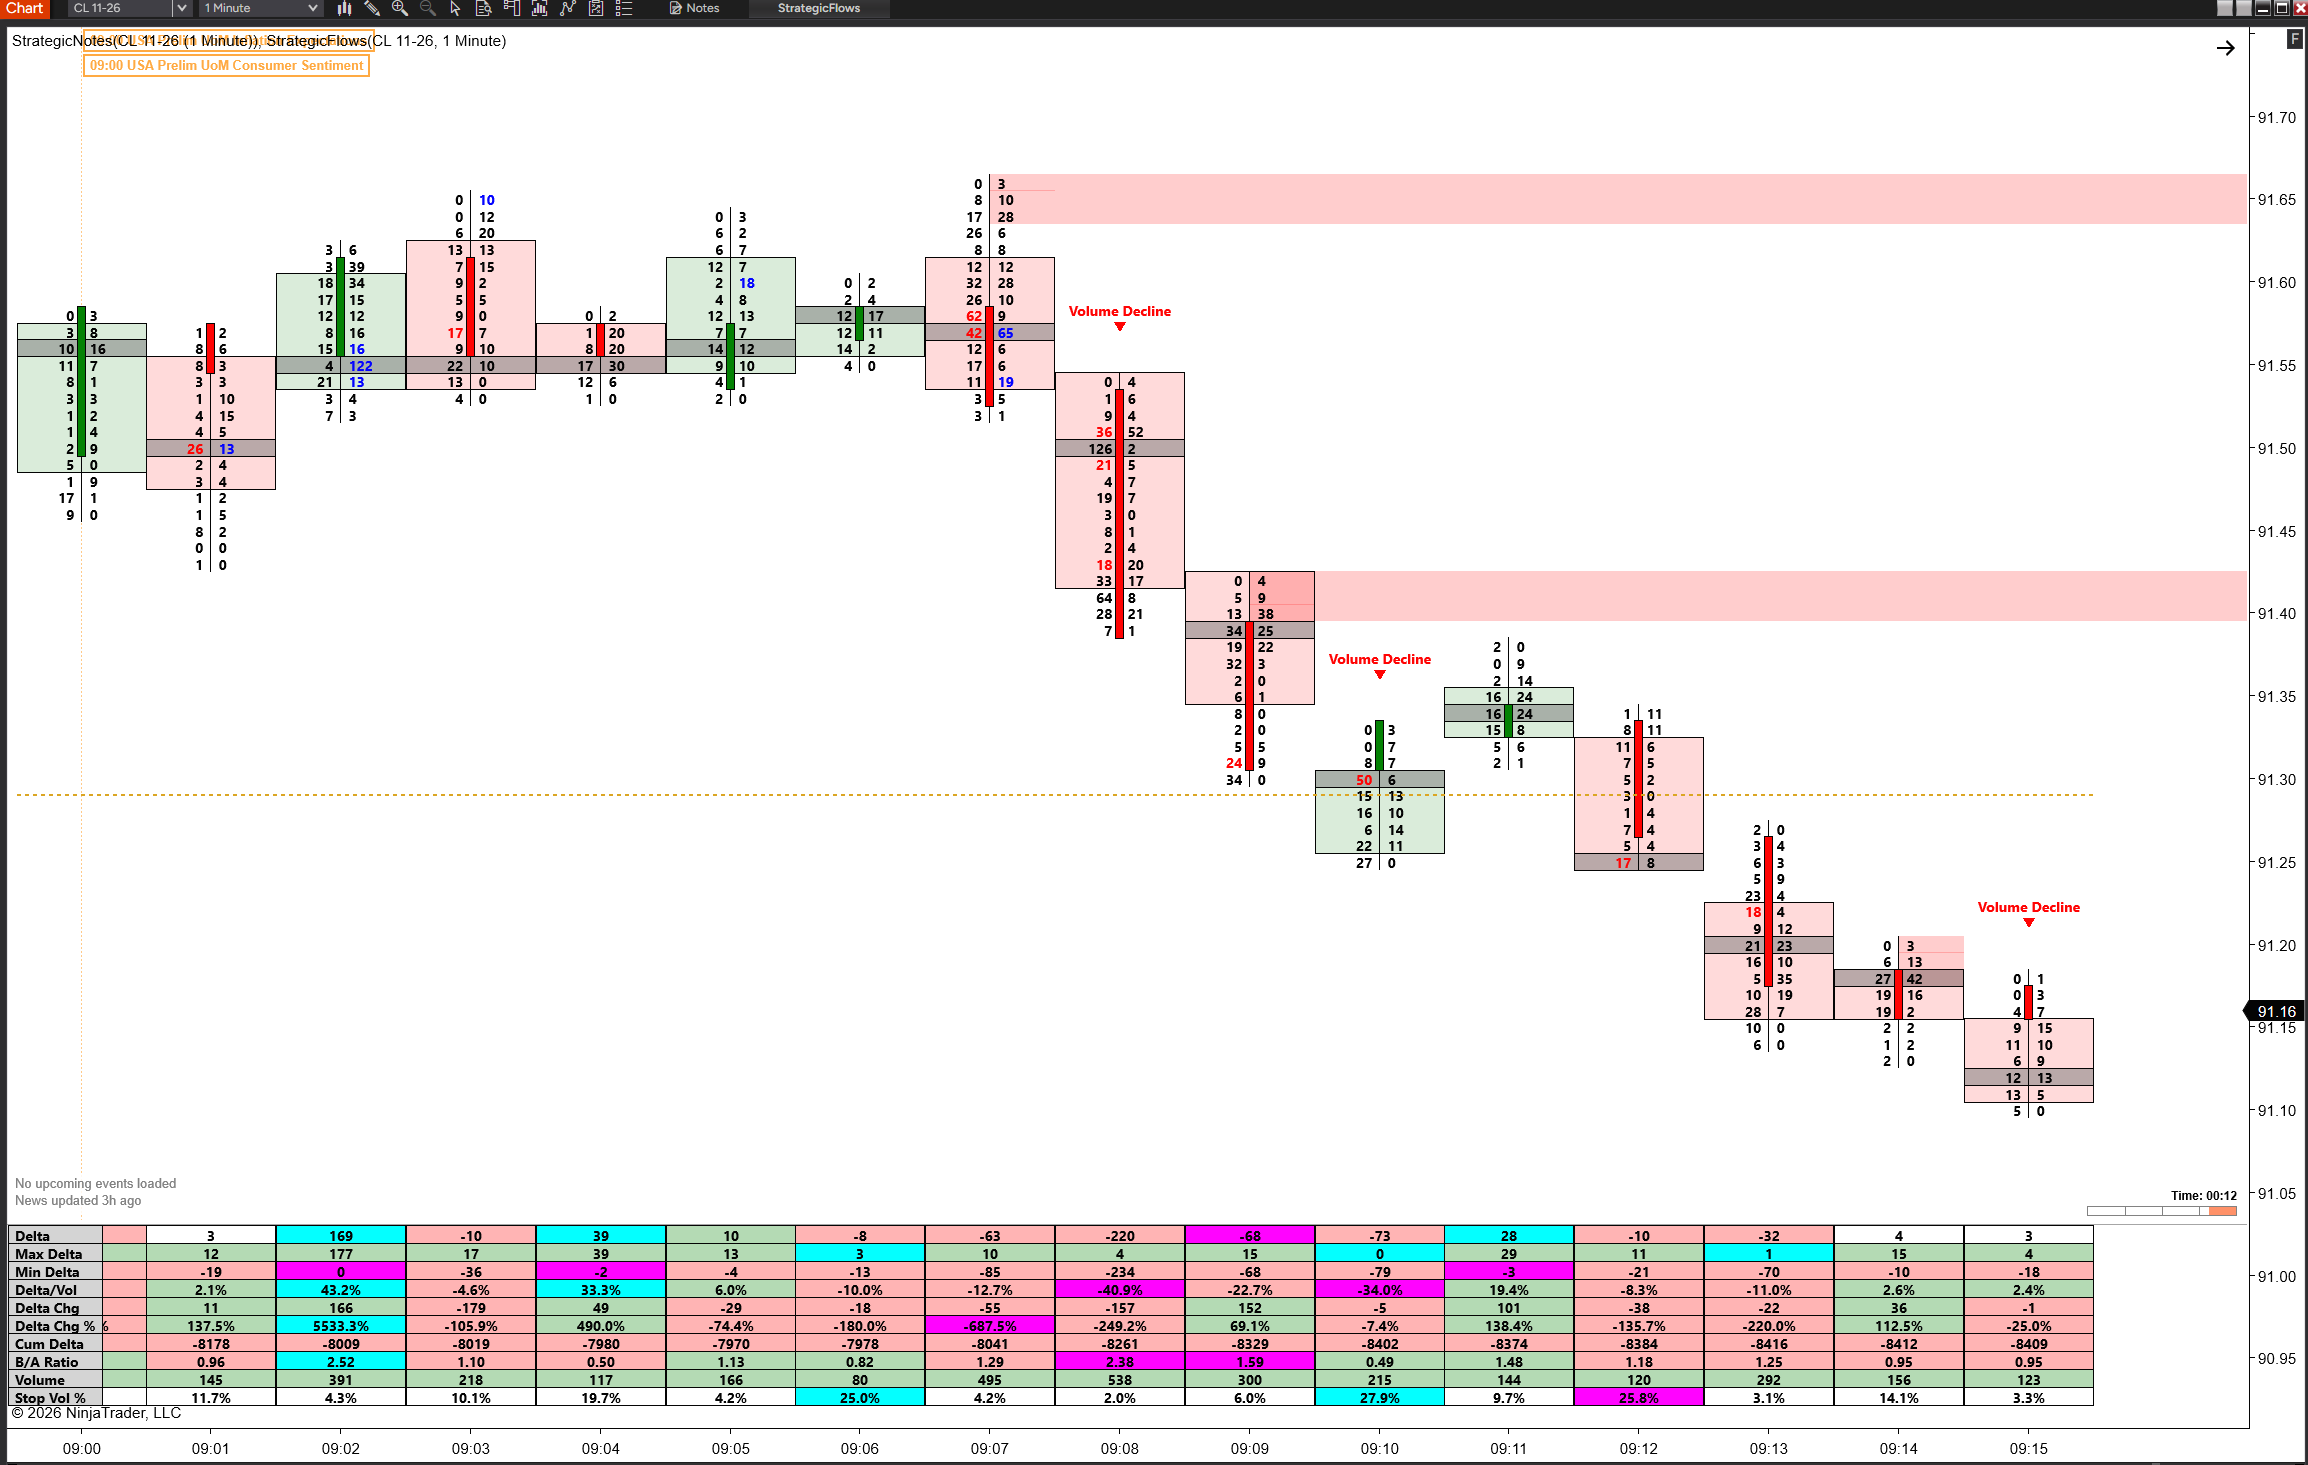
TRADE ENTRY SIGNAL ON: SAME CHART, SAME FIFTEEN MINUTES. THREE SIGNALS, EVERY ONE IN THE DIRECTION THE MARKET WAS ACTUALLY MOVING
Same CL chart, same fifteen minutes, one checkbox. Seven signals become three, and the three that remain are the ones the market backed up. You decide how much confirmation to demand (Entry Ticks) and how many bars the market gets to show it (Entry Bars). And it works on every one of the 77 signals, because when you trade order flow, you want to trade WITH the order flow, not against it.
The Interactive Chart Toolbar: Total Control, Zero Menus
Fast markets don't pause while you dig through a properties window. Every second you spend five menus deep hunting for a setting is a second you're not watching the order flow. And in a fast market, those seconds are ticks, and those ticks are money.
So Strategic Flows puts the entire control room right on the chart. One click opens it. Every signal, every filter, Consensus, Templates, Screen Mode, the Countdown, News, the Price Line, all of it sits one checkbox away, and every change applies instantly, including to your chart history, so you can SEE exactly what each switch does the moment you flip it.

THE ENTIRE PLATFORM, ONE CLICK AWAY, WITHOUT EVER LEAVING THE CHART
No properties dialog. No OK button. No reloading the chart. You change your mind, the chart changes with you, and your eyes never leave the market.
And the rest of the toolkit, all included:
- POC highlighting + naked POC extensions
- POC 2 and POC 3 (second and third heaviest levels)
- Per-bar Value Area with directional shading
- Lowest Volume Levels with until-tested lines
- Imbalance highlighting + extended imbalance bands
- 14-row Order Flow Statistics panel with auto-highlights
- Current Day Open / High / Low session lines
- News calendar with the upcoming-events panel
- 5 ready-made signal Templates
- Tick Aggregation for fast markets like NQ
- One-click White Mode / Dark Mode
- Trade Entry Signal price-confirmation mode
- The on-chart toolbar menu for everything
- Live signals on the forming bar, not after the close
- BloodHound-readable plots on all 77 signals
- Plain-English User Guide + Signal Cheat Sheet
See it in action
Watch This Special Walkthrough Training
Don't take my word for any of this. Watch me pull Strategic Flows up on my own charts and walk through it, piece by piece, so you can see exactly what it does and how to use it before you spend a dime.
WATCH: THE FULL STRATEGICFLOWS WALKTHROUGH
Why This Works When Everything Else You've Tried Didn't
Every trading purchase you've ever made was a bet on one of four things: a bigger outcome, a better chance of getting it, less time, or less effort. Here's where Strategic Flows stands on all four:
- The outcome: reading the market the way the floor read it. Not predicting. Seeing who is winning the fight right now, at which exact prices.
- The likelihood: the Consensus engine means you act on stacked, independent evidence instead of one pretty arrow. Your standard, enforced mechanically, on every bar.
- The time: Templates and the toolbar mean you're watching a proven signal layout the first hour you install it. The guide explains every setting like you just walked in off the street.
- The effort: no coding. No building. Checkboxes and radio buttons, all from a toolbar menu on the chart. Flip a filter and history re-draws instantly so the software teaches you itself.
Five Markets. Five Bar Types.
The Same Easy Read.
Good trading opportunities in the order flow aren't hidden. They're just invisible on candlesticks. Strategic Flows points at the bar, names the behavior, and lets you decide. Here's what that looks like on real charts, across completely different markets.
Crude Oil (CL), 1000-volume bars. A hard sell-off, and then the evidence piles up at the low: Order Flow Ratio Bounds Low reads 0.18 (the extreme defended with size), Imbalance Reversal and Inverse Imbalance print, and Retail Suck flags the thinning ladder that tempts the crowd in at the worst moment. One signal is an observation. A cluster of them at a low is a spot worth your full attention, and the market turned right there.
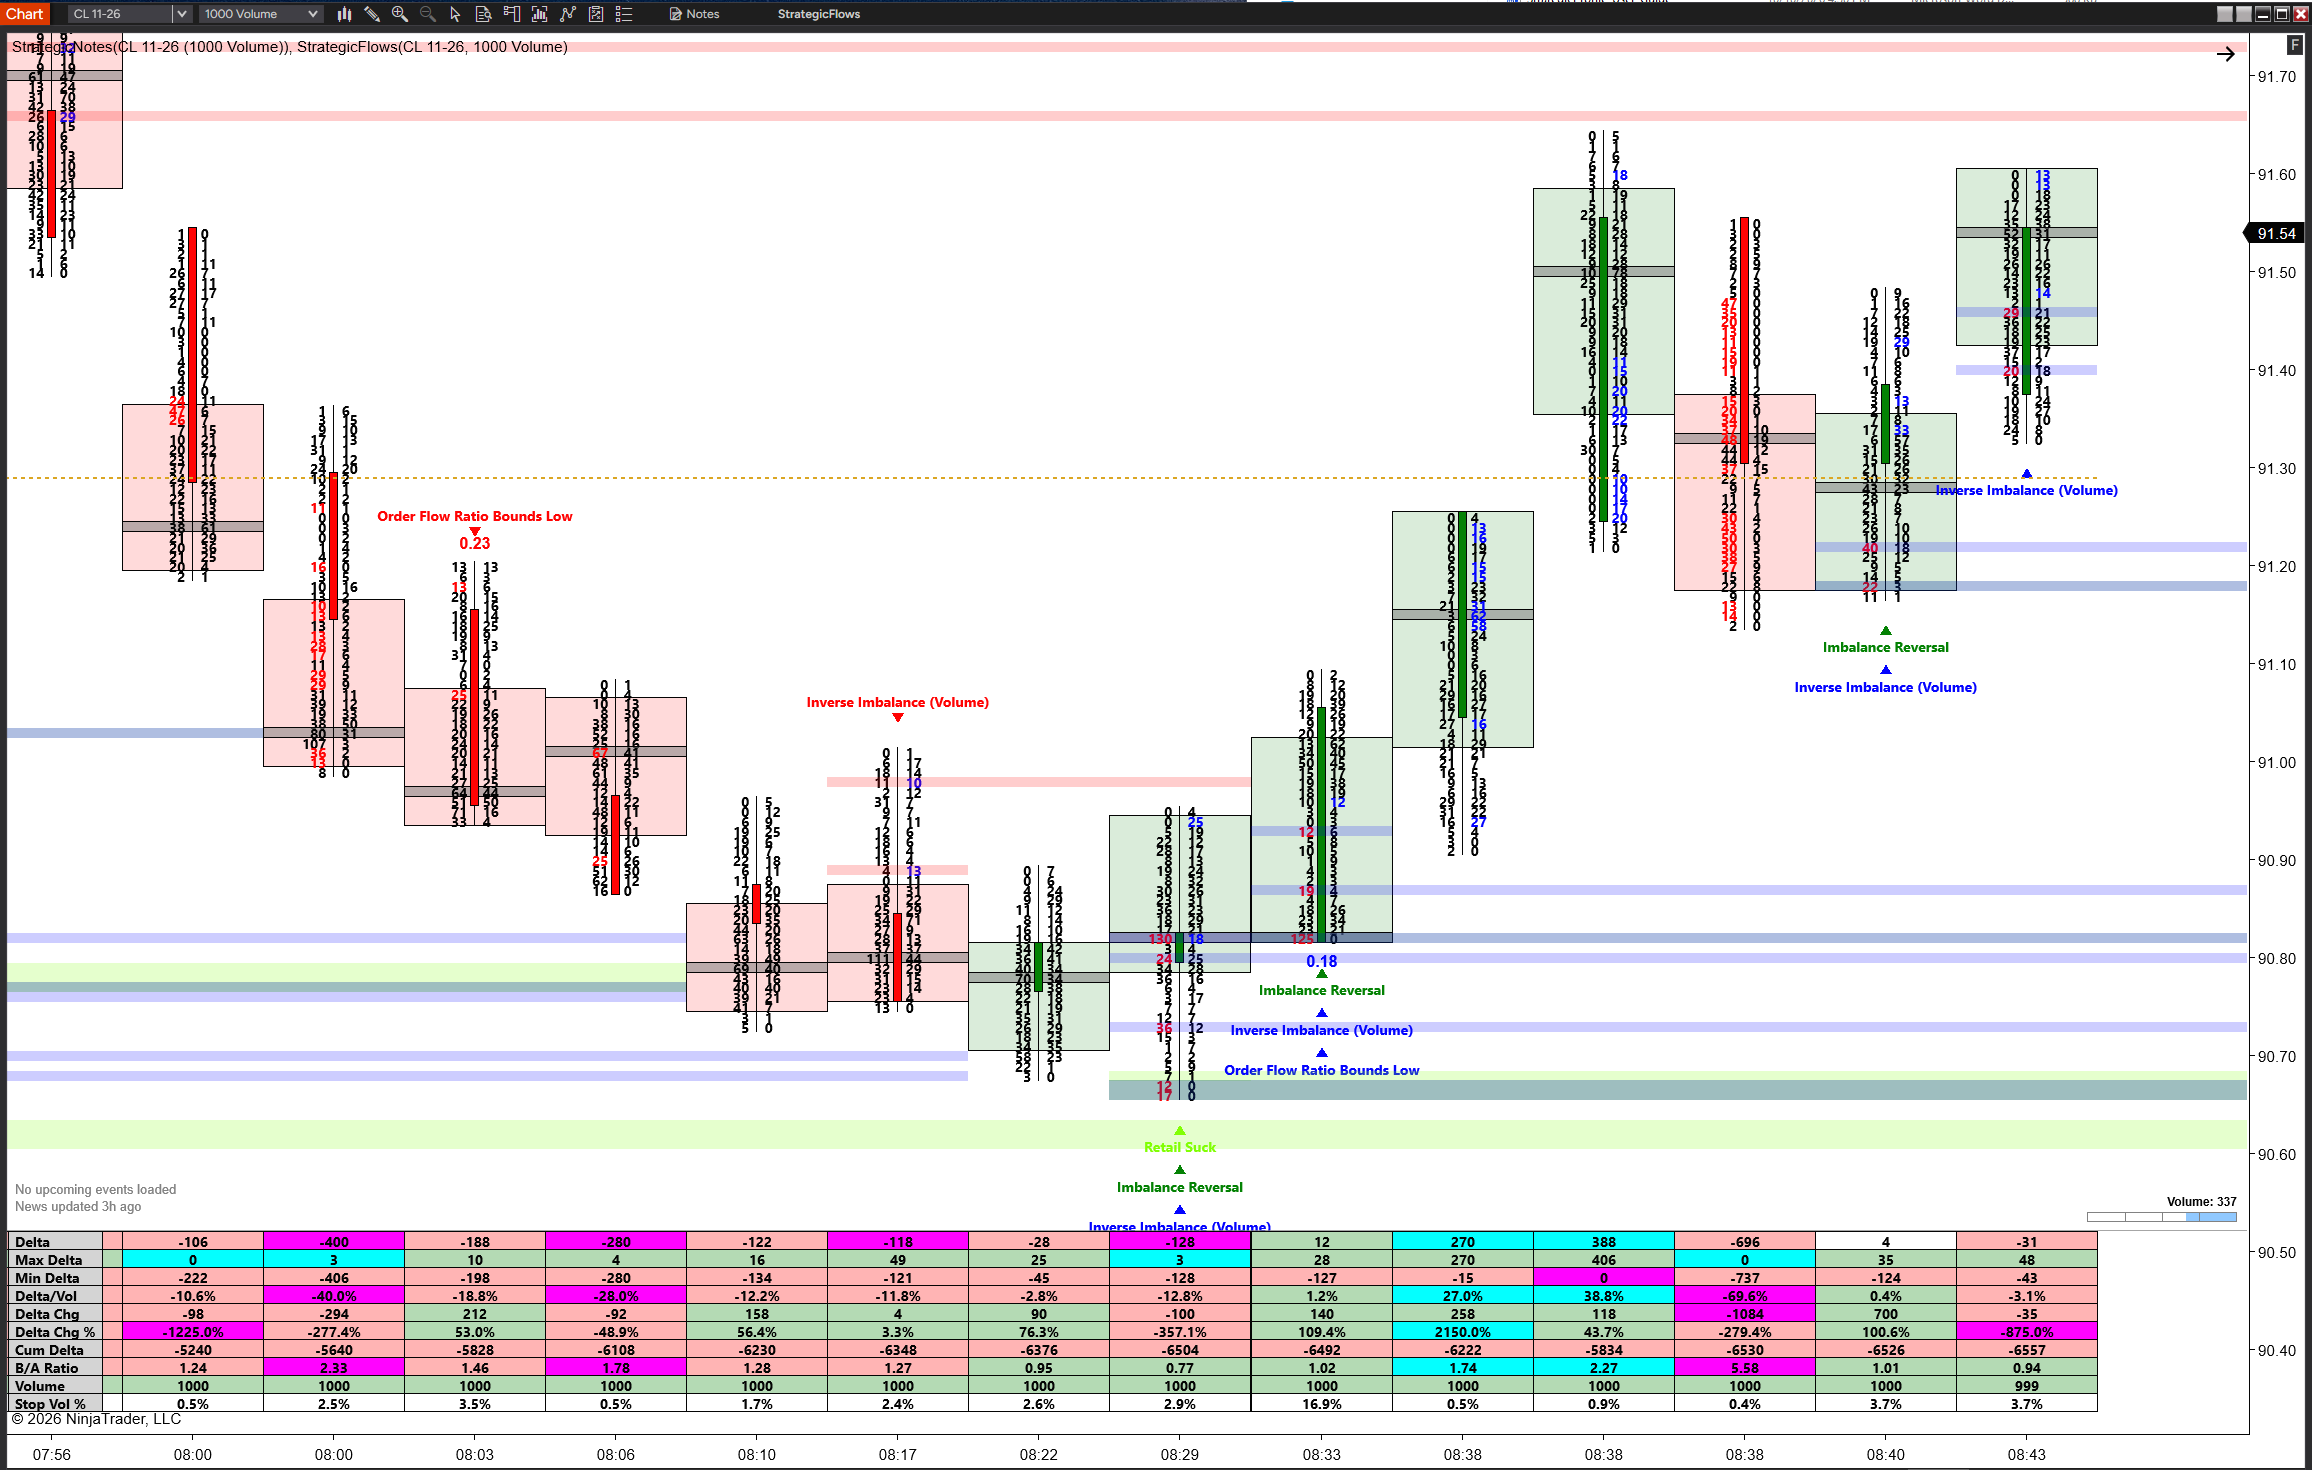
CL ON VOLUME BARS: THE SIGNALS GANG UP AT THE LOW, THEN THE MARKET TURNS
Euro FX (6E), 8-range bars. A trend day, read bar by bar: Open POC printing again and again as the heaviest business keeps happening in brand-new territory, with Value Area Gaps and Thin Prints marking the holes the market left behind in its hurry. When acceptance itself keeps relocating higher, you don't need to guess whether the trend is real.
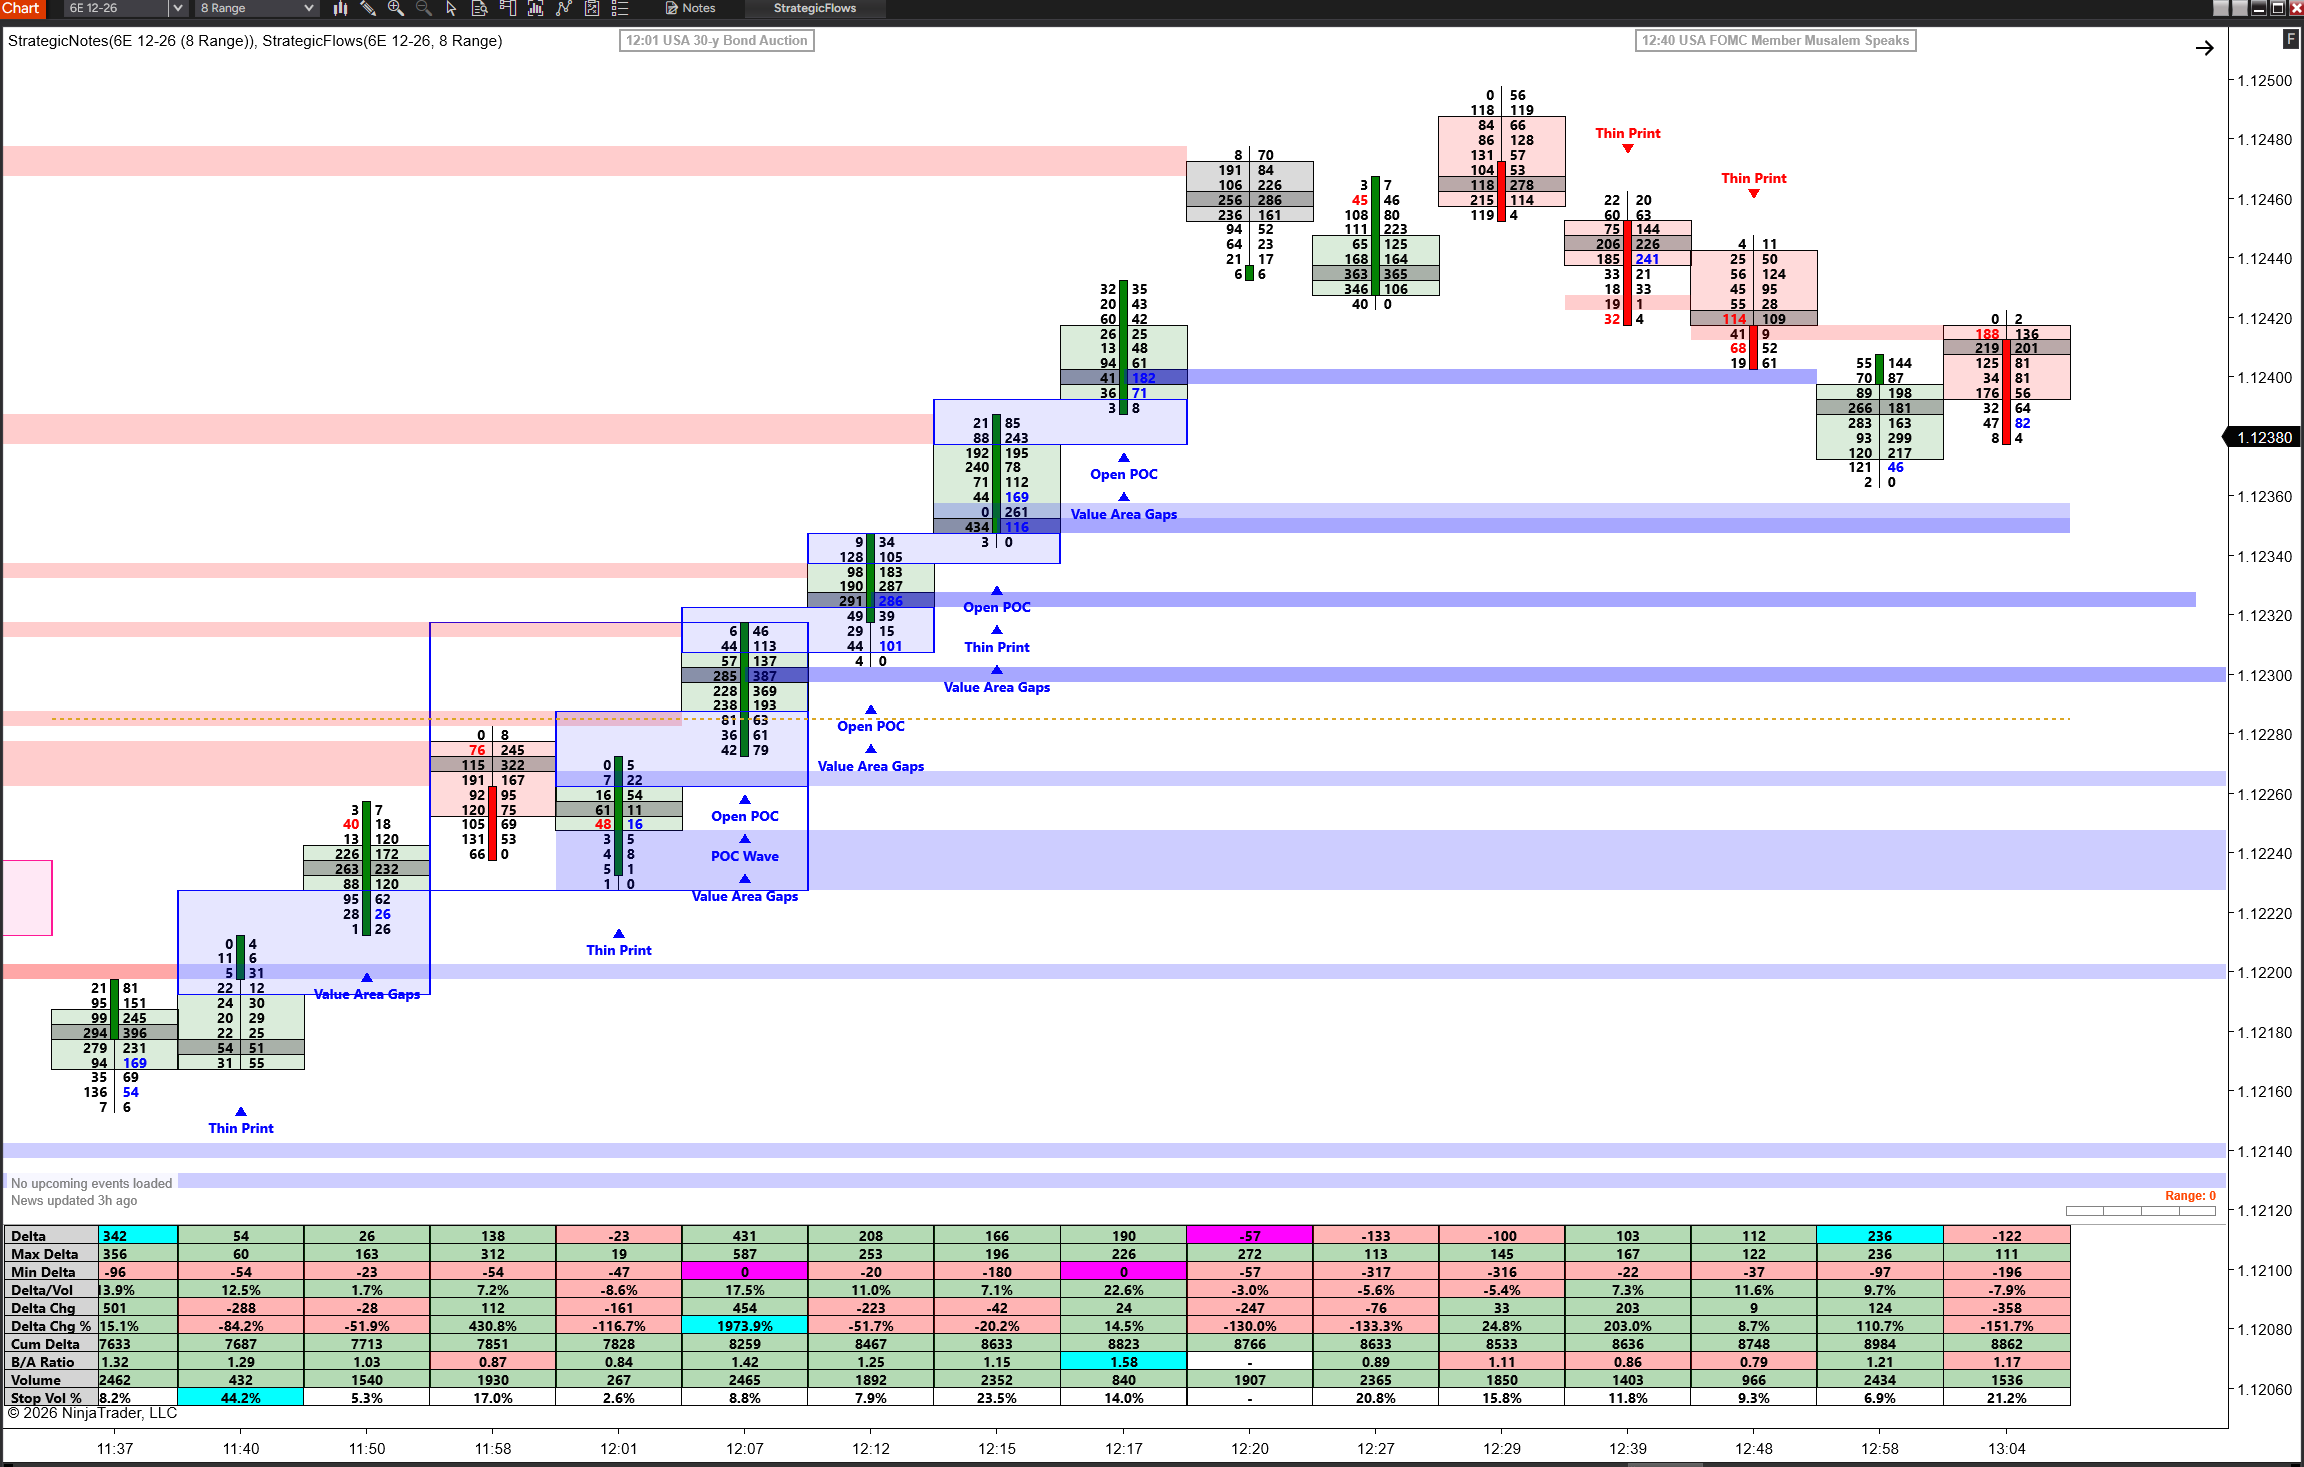
6E ON RANGE BARS: OPEN POC AFTER OPEN POC. ACCEPTANCE ITSELF KEPT MOVING HIGHER
Soybeans (ZS), 3-minute bars. Extreme Delta marking the bars where one side didn't just win, it steamrolled, at both edges of the session's range. Conviction pushes stand out from drift the moment they happen, even in a market most footprint traders never look at.
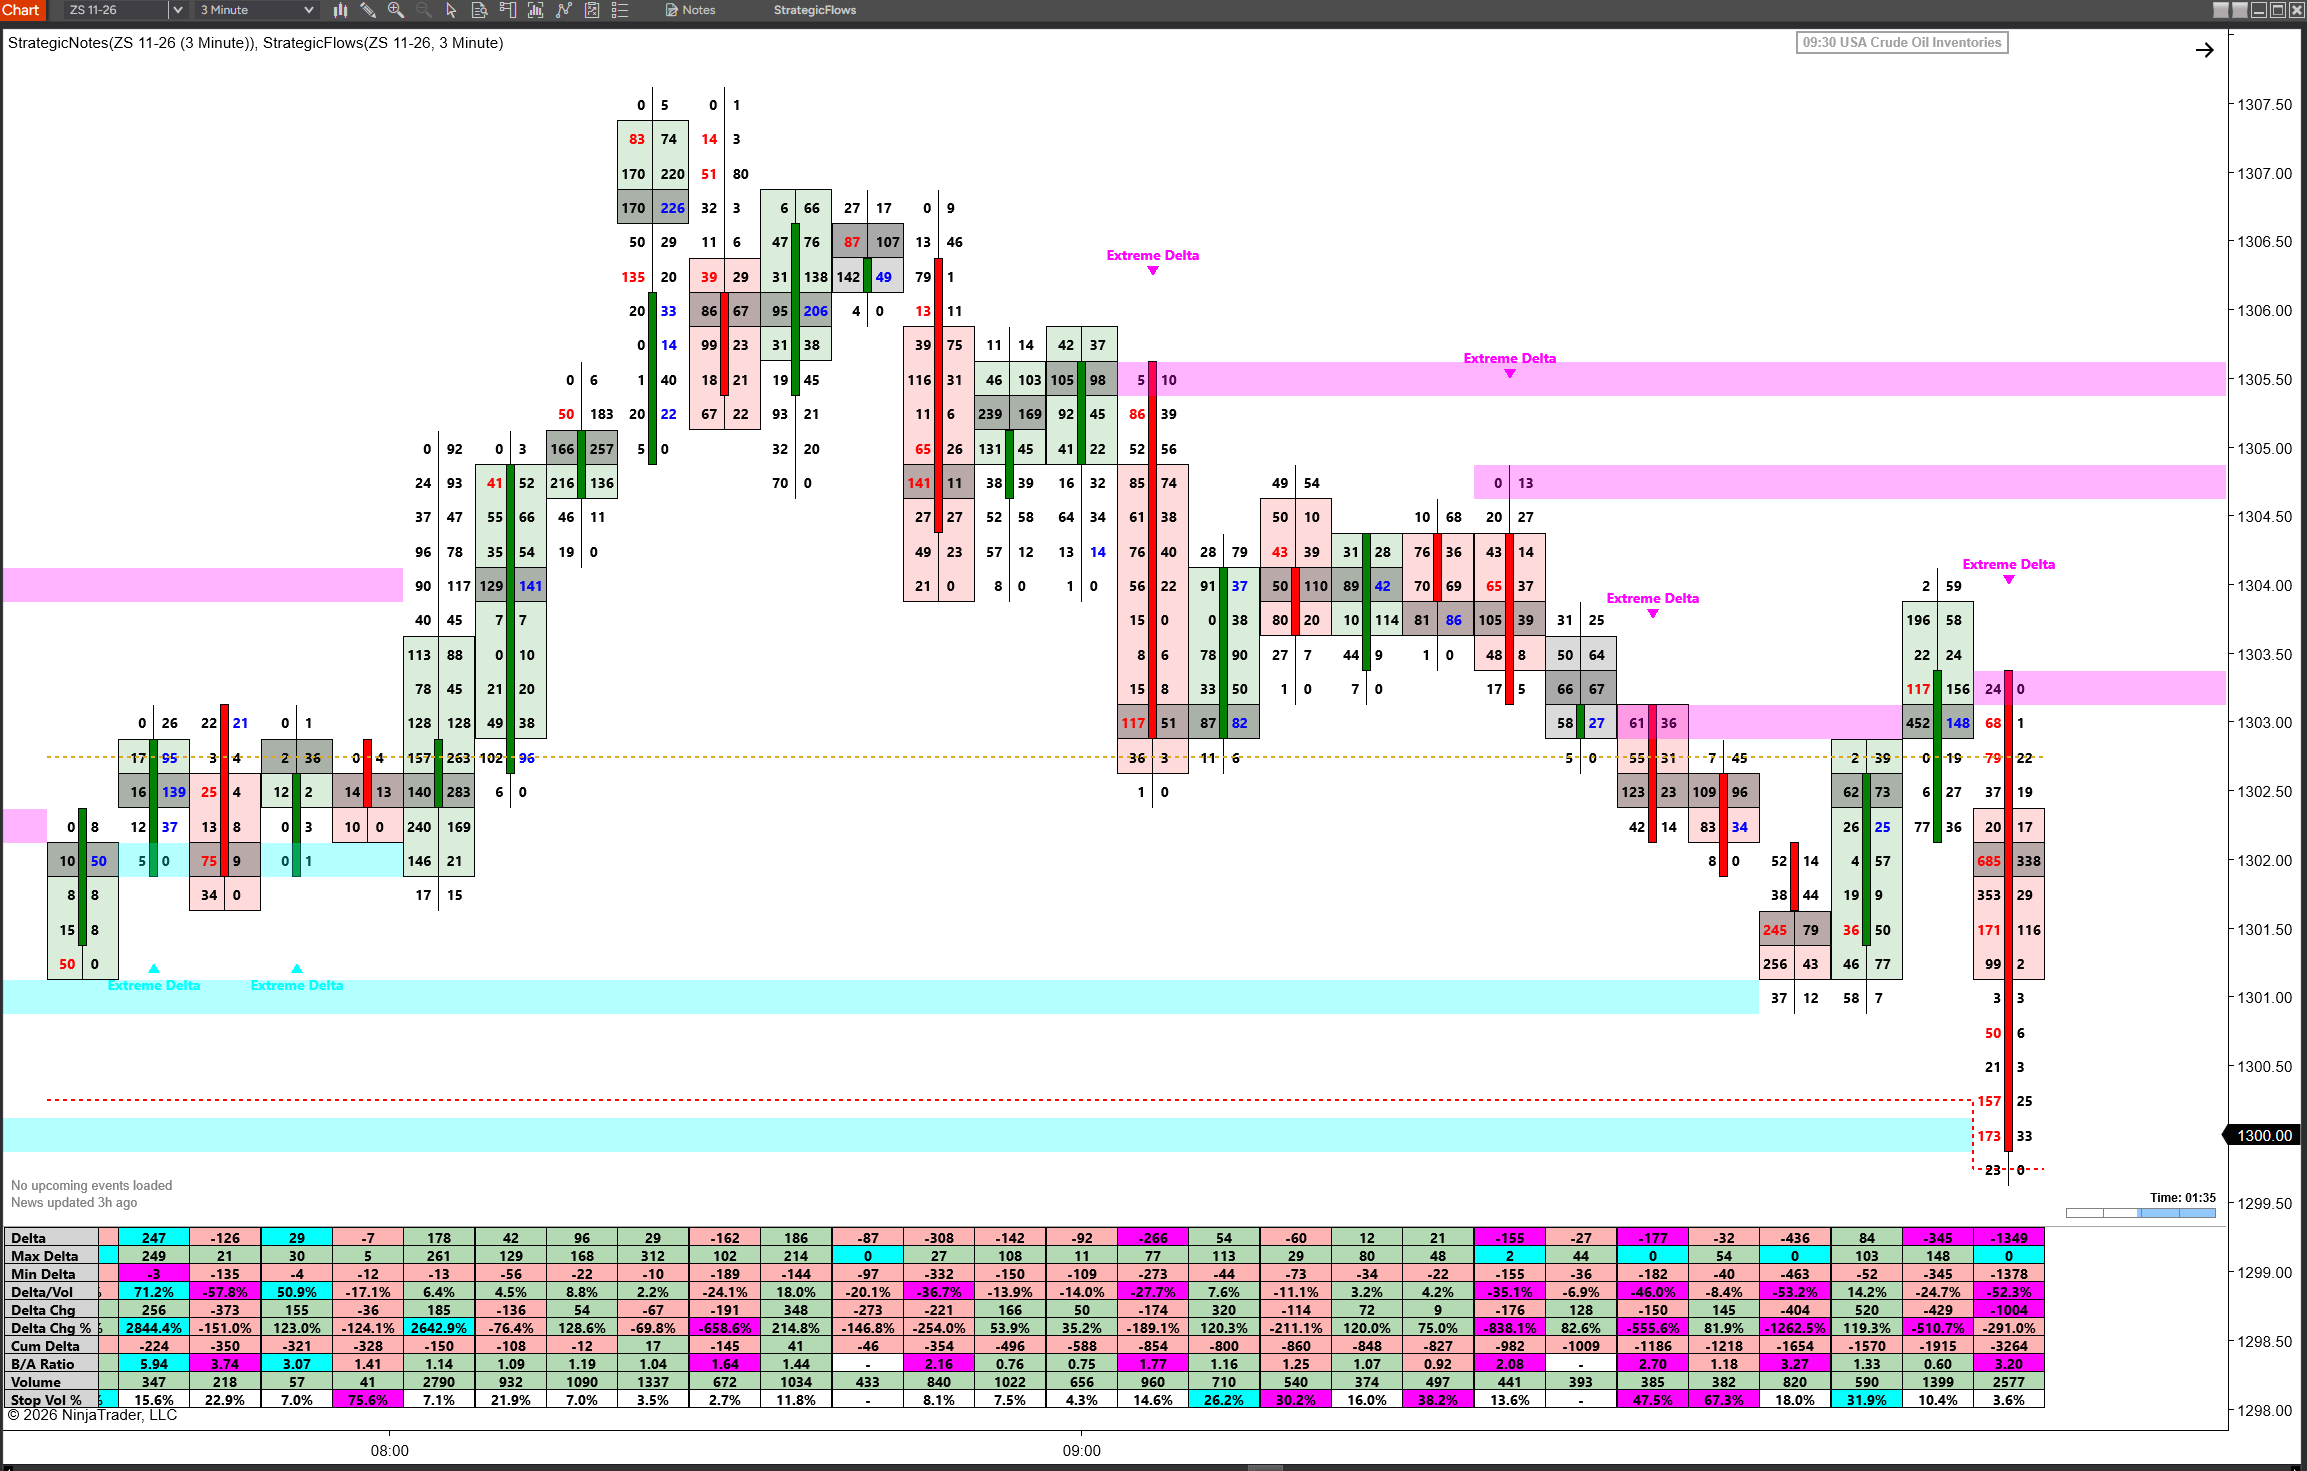
ZS ON MINUTE BARS: EXTREME DELTA SEPARATES THE CONVICTION BARS FROM THE DRIFT
Micro Nasdaq (MNQ), 1-minute bars. Price pops to a new high, and Order Flow Ratio Bounds Low prints twice, 0.33 and 0.43, right at the top: the extreme being defended with size, reduced to a single number. The chart said "this high is being fought for" before the fade, not after it.
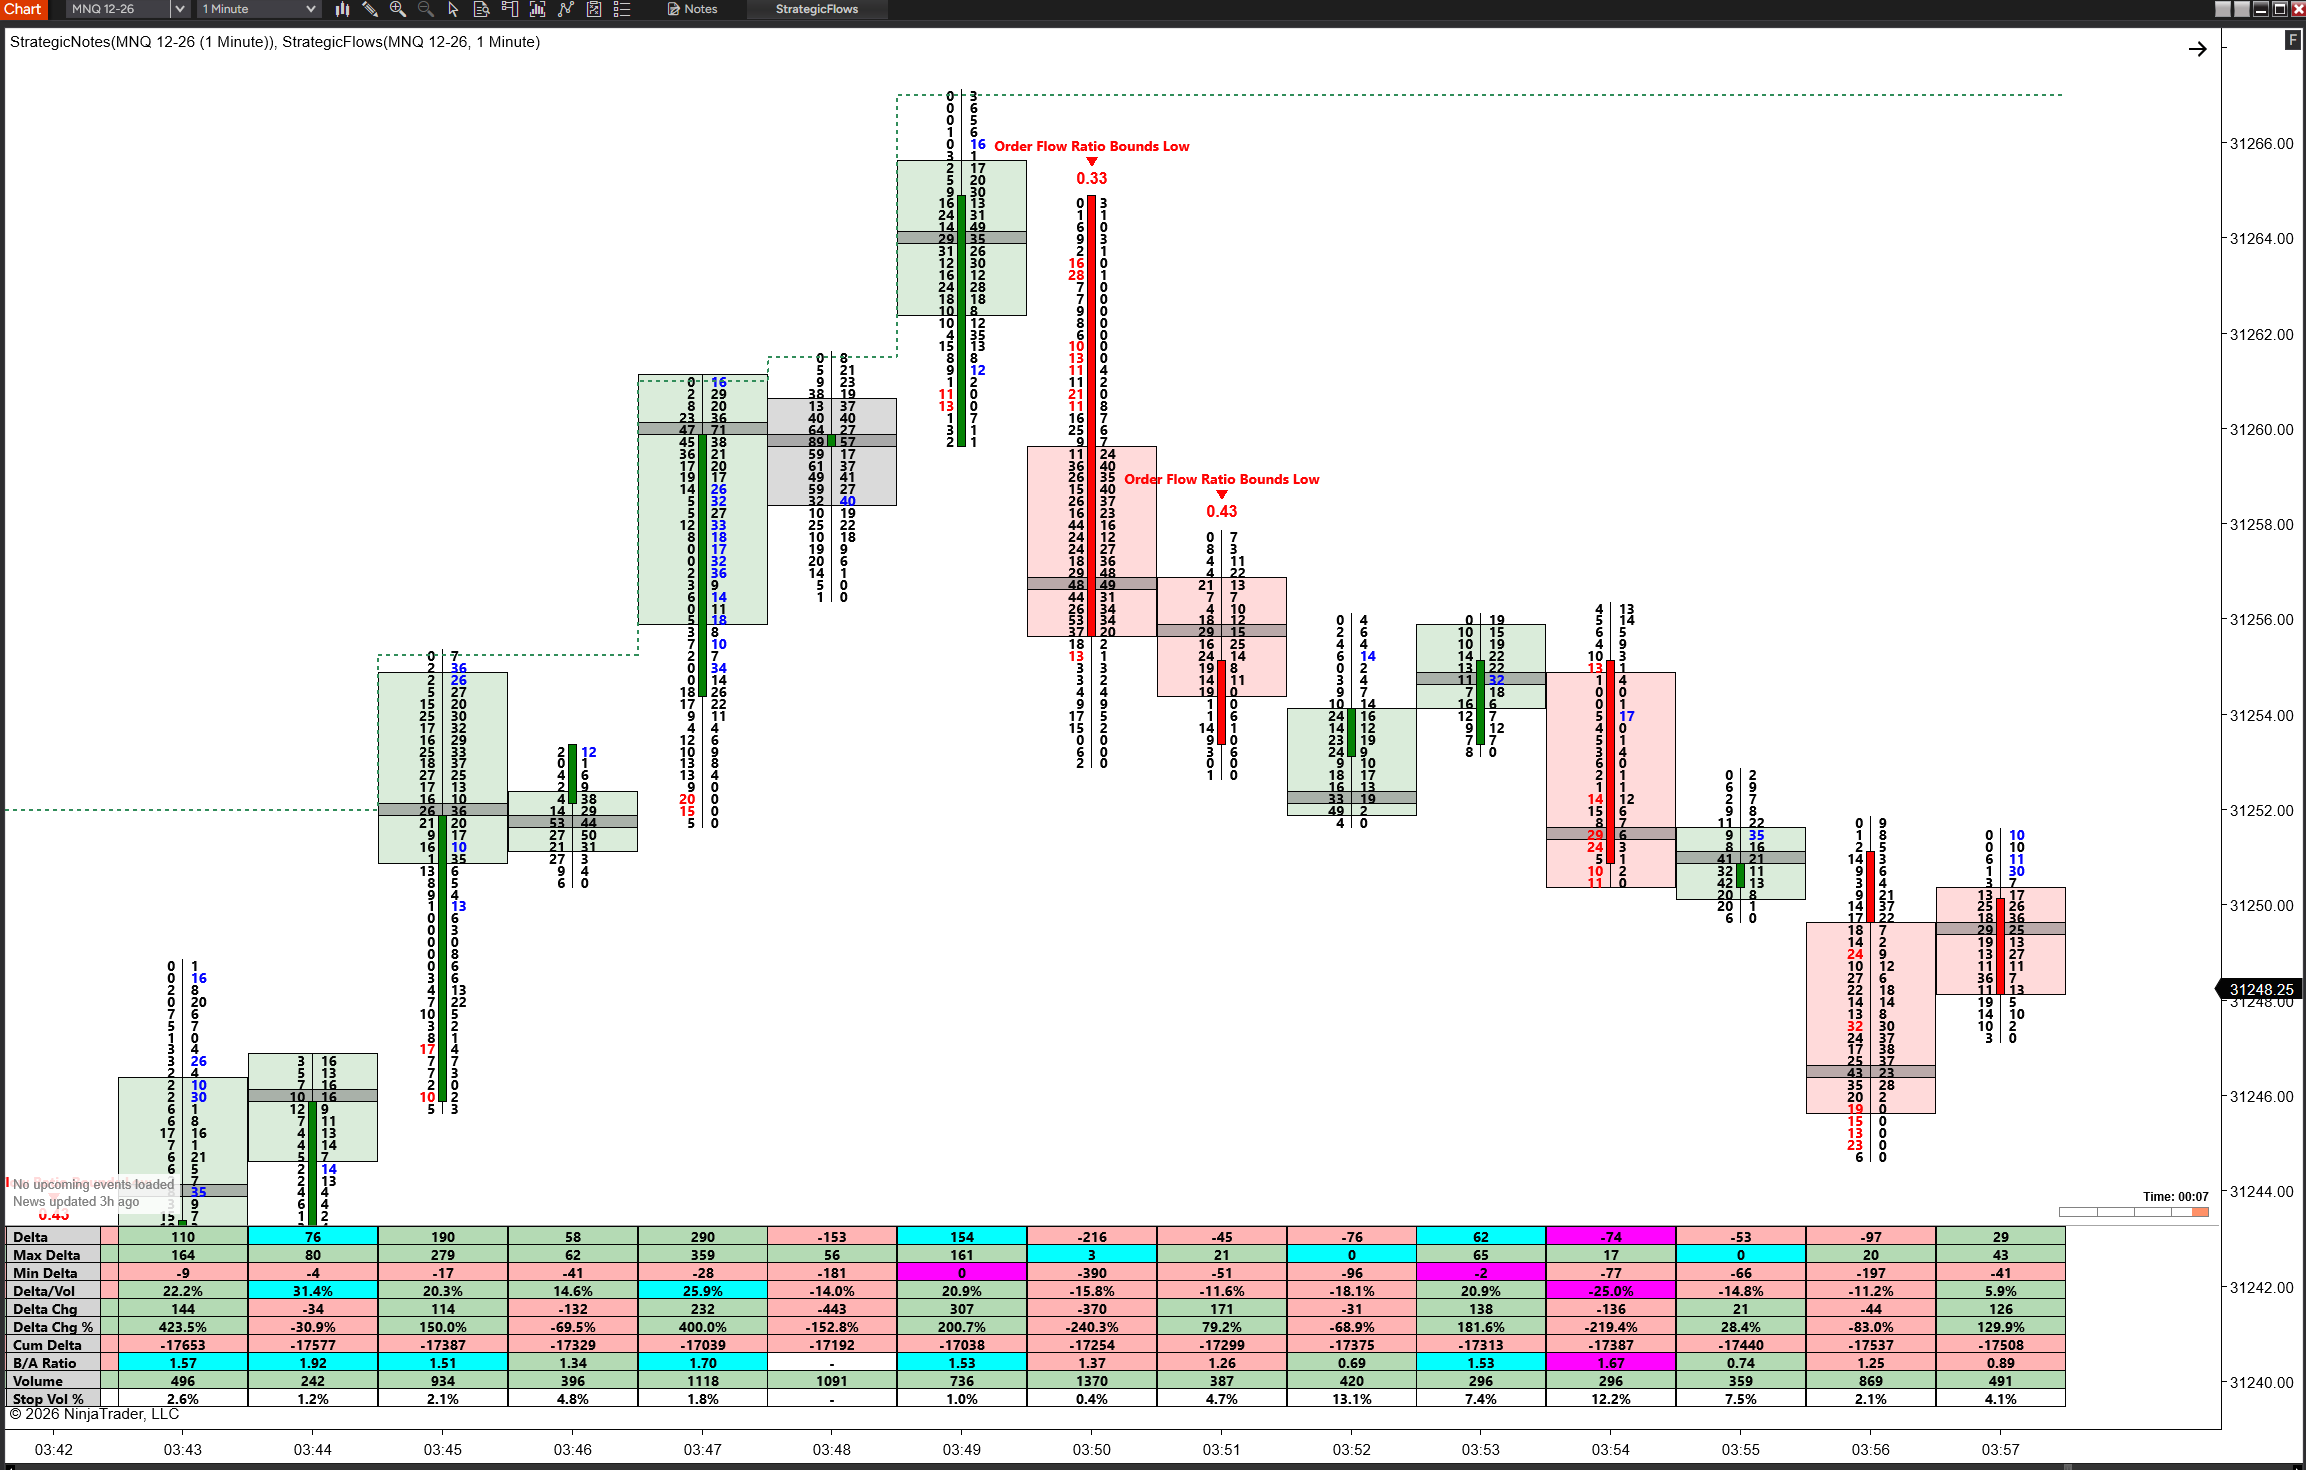
MNQ ON 1-MINUTE BARS: RATIO BOUNDS LOW FLAGS THE DEFENDED HIGH BEFORE THE FADE
30-Year Bonds (ZB), 4-range bars. Even in the slow, heavy world of treasuries, the footprint talks: Imbalance Bumper marks the bars where both armies got aggressive and the close named the winner, with the battle lines drawn near the low before the climb.
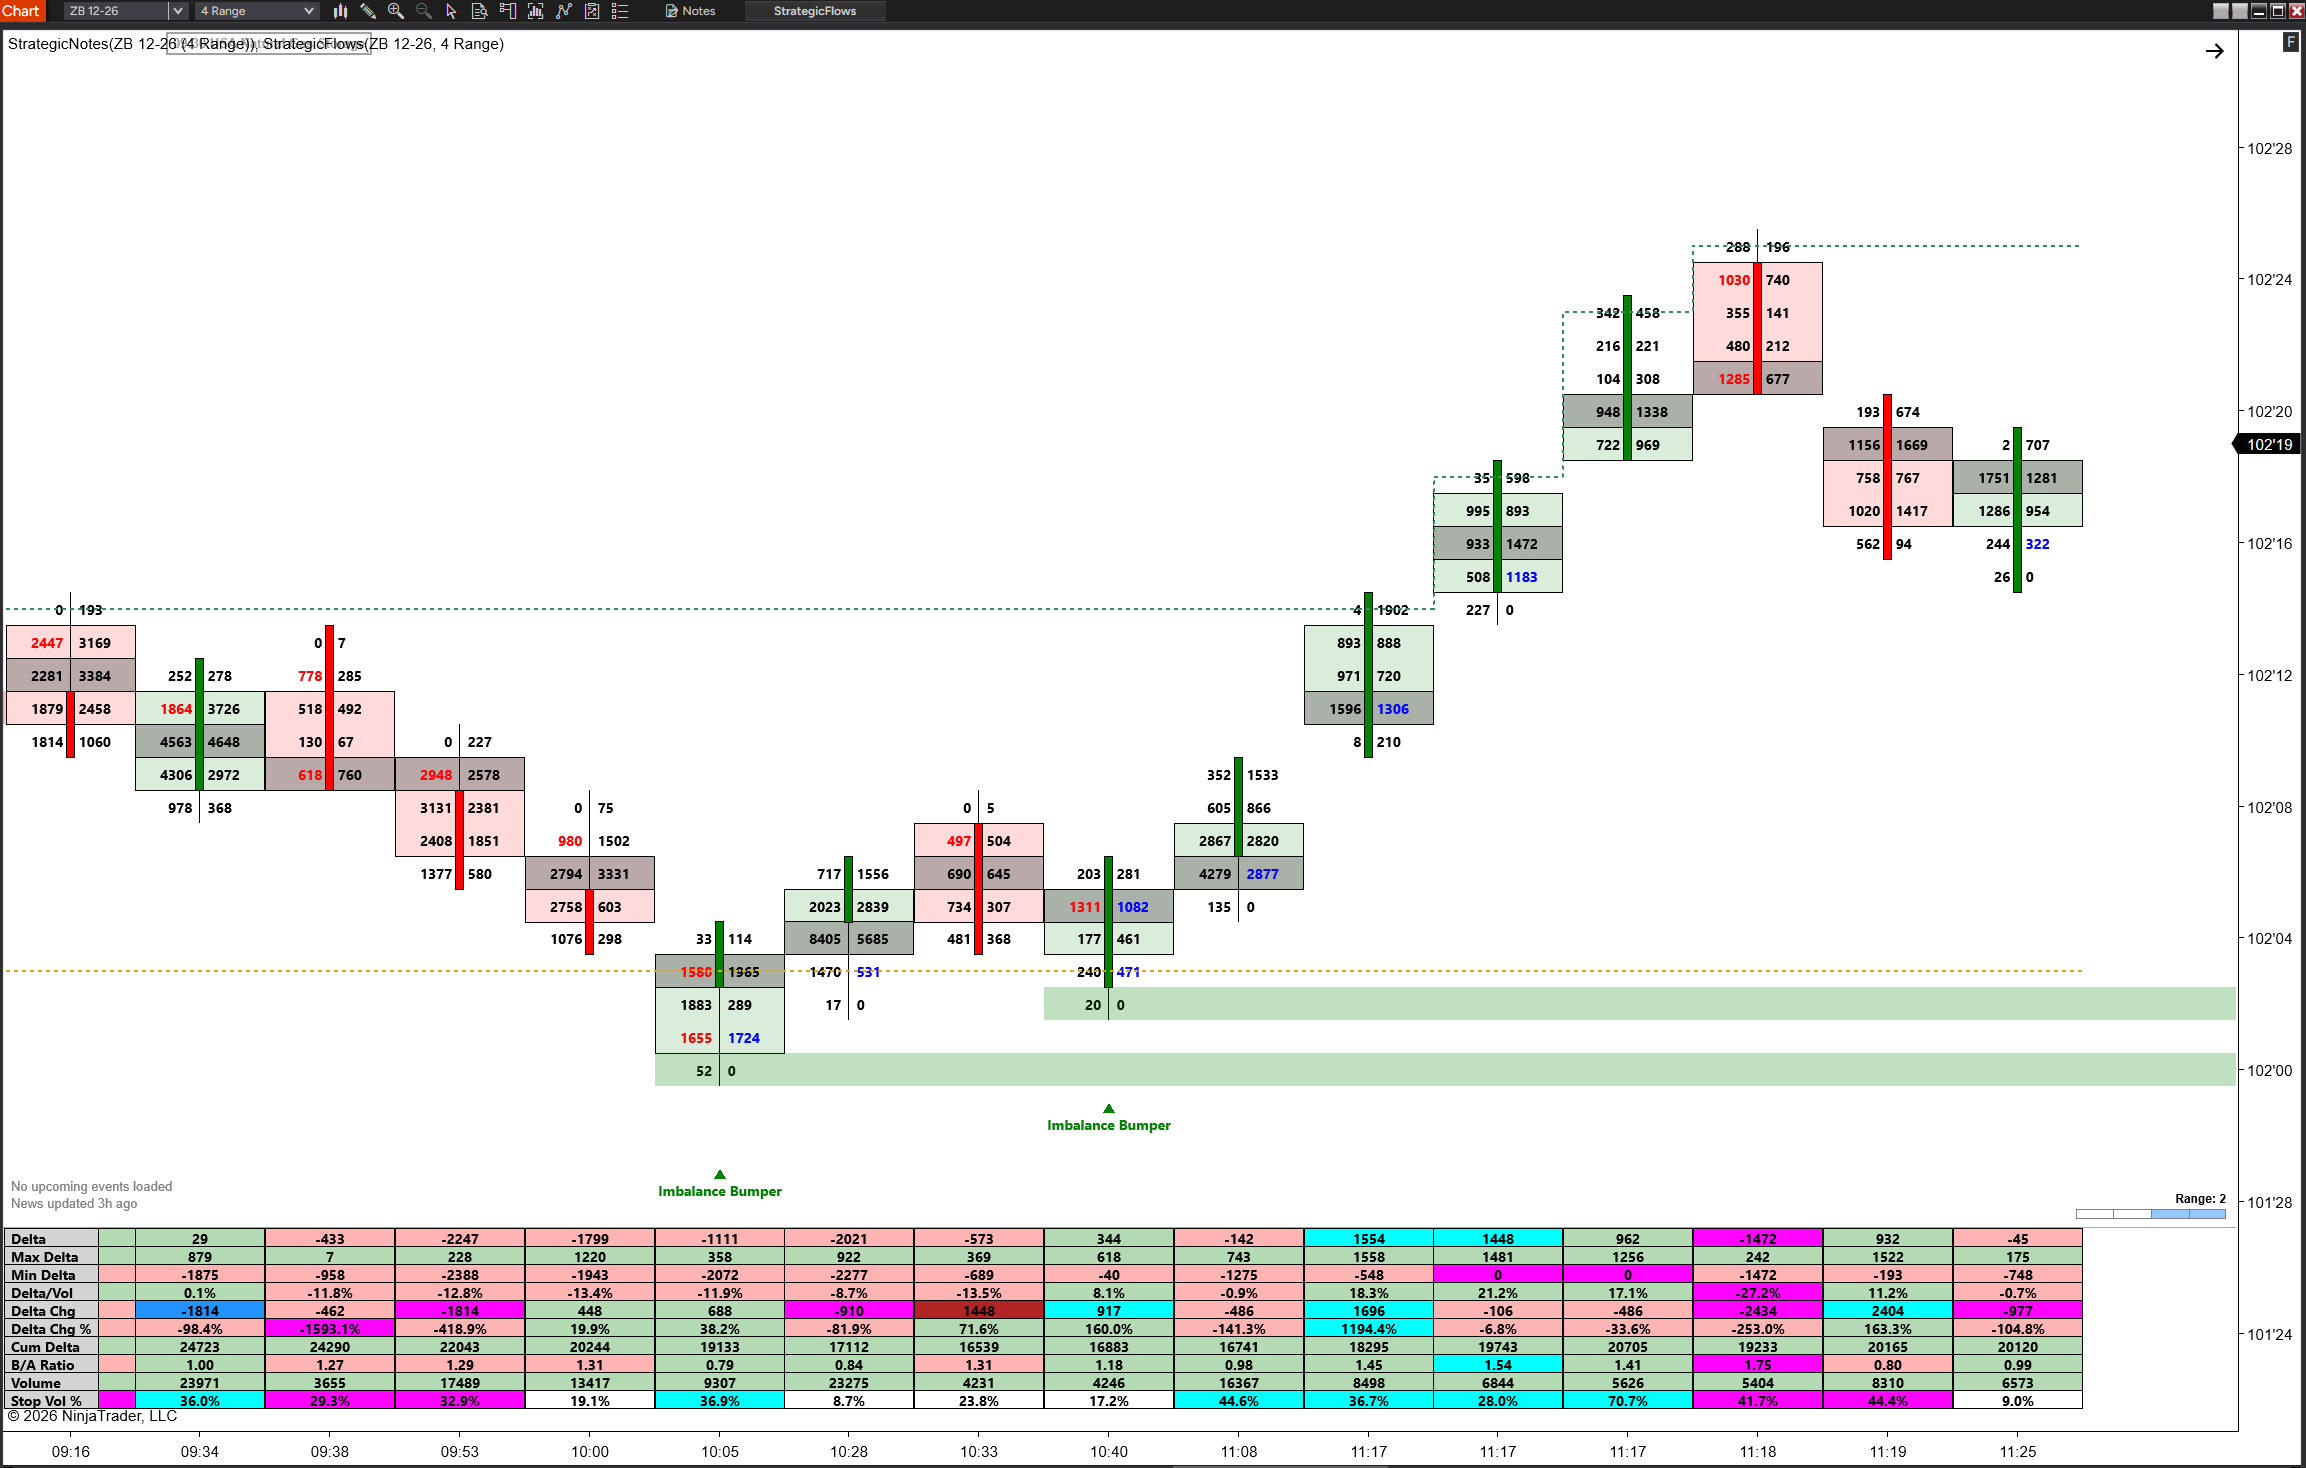
ZB ON RANGE BARS: IMBALANCE BUMPER DRAWS THE BATTLE LINES NEAR THE LOW
Crude on volume bars. The euro on range bars. Beans on minute bars. The micro Nasdaq and the long bond. Different markets, different speeds, different bar types, and the exact same read: the signals point at the bar, name the behavior in plain English, and leave the decision where it belongs. With you.
Three Standalone Products. Today, They're Your Bonuses.
These aren't PDFs or "cheat sheet" bonuses padded in to inflate a number. All three are real, standalone NinjaTrader 8 tools that sell on their own. Order Strategic Flows today and they're simply included.
BONUS #1: Strategic Profile ($399 standalone)
The footprint is a microscope: it shows you one bar at a time, in complete detail. Strategic Profile is the satellite map. It builds a volume profile over any range you choose, with the value area, VAH, VAL, the POC, and the high and low volume nodes, the shelves and air pockets of the whole session or week. You switch the period from a dropdown right on your toolbar.
Why it matters: every signal in Strategic Flows means MORE at a level that matters. An exhaustion print at a profile low volume node is a different trade than the same print in the middle of nowhere. This is the map your footprint signals fire against.
BONUS #2: Strategic Notes ($299 standalone)
A clean notes box that lives on your chart. Your daily plan, your rules, your levels, your "do not trade the first 5 minutes after CPI," pinned where your eyes actually are during the session, instead of in a notebook you stop opening by Wednesday.
Why it matters: the most expensive trades of your month are the ones your own plan told you not to take. A sticky note on the monitor falls off. This one is ON the chart, between you and the buy button.
BONUS #3: Strategic Screenshot ($299 standalone)
One button on your toolbar. Click it and your chart is captured, ready for your journal, your trading group, or your own playbook. No snipping tool, no cropping, no "I'll remember this setup." You won't. Click the button.
Why it matters: every serious trader I've known in 30 years reviews their trades. The screenshots you take of real setups, with the order flow visible, become a playbook no course can sell you, because it's built from YOUR markets and YOUR trades.
$997 worth of standalone tools, included free with your order today.
Here's Everything You Get Today
| Strategic Flows The complete footprint platform: 77 signals, the Consensus engine, News, Countdown, Price Line, Templates, BloodHound compatibility, User Guide and Cheat Sheet | $1,997 retail |
| BONUS #1: Strategic Profile Range volume profile with value area, VAH, VAL, POC and high/low volume nodes, with a one-click period dropdown on your toolbar. The map your footprint signals fire against | $399 value |
| BONUS #2: Strategic Notes Your trading plan, pinned to the chart. An on-chart notes box so your rules, levels and daily plan stay in front of your eyes where they can actually stop a bad trade | $299 value |
| BONUS #3: Strategic Screenshot One-click chart capture from the toolbar. Journal every trade, share setups with your trading group, build your own playbook of real examples | $299 value |
| Total Value | $2,994 |
Get It All Today: $2,994 $499
One-time payment. Not a subscription.
GET STRATEGIC FLOWS + ALL 3 BONUSES
All 3 bonuses are included with every order, whichever way you pay.
PAY WITH STRIPE →CREDIT OR DEBIT CARDOR
PayPal · PAY WITH PAYPAL →The green button checks out through Stripe (credit or debit card). The gold button checks out through PayPal.
Either way, please allow 3-6 hours for your order to be processed (usually sooner).
Works with your NinjaTrader 8. One-time payment.
The 30-Day "Trade It on Your Charts" Guarantee
Install Strategic Flows, load it on the markets you trade, and put it to work for a full 30 days. If at any point you decide it isn't right for you, for any reason, email us and we'll refund 100% of your purchase price. No questions. No hoops. No "prove you used it" checklist. We take on the risk, not you.
A Straight Word About The Price
Strategic Flows is $1,997 retail. Today, it's $499. One payment. No subscription, no monthly data fee to me, no "pro tier" waiting behind another paywall. The software, all 77 signals, the Consensus engine, every update, and all three standalone bonus tools, yours.
Is that a lot for software? Compared to a $299 indicator from a marketplace, sure. But that's not what this competes with. Traders routinely spend more than this on one course that leaves them staring at the same chart with the same confusion. And every trader reading this knows what a single week of trading blind costs.
You're not buying 77 signals. You're buying the ability to read what the market is doing while it's doing it, with a standard of evidence built in, from someone who spent 30 years learning it where it couldn't be faked.
Who This Is For (And Who It's Not For)
Strategic Flows is for you if:
- You trade futures on NinjaTrader 8 (ES, NQ, CL, GC, bonds, currencies... any liquid market)
- You suspect the real information is in the volume, not the candle colors
- You've caught yourself talking your way into trades on one signal, and you want a chart that holds the line for you
- You want to learn order flow properly, with a guide written in plain English by someone who learned it on the floor
It is NOT for you if:
- You want a magic arrow that promises profits. No honest tool can promise that, and I won't pretend otherwise
- You won't put in a week of screen time learning what the signals mean
- You don't have NinjaTrader 8 and a real-time data feed
Frequently Asked Questions
Do I need NinjaTrader 8?
Yes. Strategic Flows is built for NinjaTrader 8, which is free to use for charting with a funded or demo data feed. You'll need Tick Replay enabled, and the guide walks you through it with screenshots-level detail.
Is this an Orderflows Trader upgrade?
No. Strategic Flows is a completely new direction, built with a new team. It looks and feels familiar on purpose, so experienced footprint traders are at home in minutes, but the engine, the signal library and the Consensus system are new from the ground up.
What markets does it work on?
Any market NinjaTrader charts with bid/ask data: index futures, energies, metals, bonds, currencies. The defaults are tuned for liquid markets like ES, and the guide explains the handful of settings to adjust for thinner ones.
Can I automate the signals?
Yes. Every signal writes plot values readable by BloodHound and other NinjaScript tools, including the Consensus signal itself, so your whole evidence standard can drive an automated or semi-automated system.
When I load Strategic Flows on my chart, I don't see any signals. Why?
Strategic Flows reads the volume traded at the bid and at the offer. It works on real-time data as it comes in, and on recorded data in Market Replay. To see the footprint and signals on historical bars, turn on Tick Replay in NinjaTrader 8. Without Tick Replay, Strategic Flows starts reading data from the moment you apply it to a chart. Also check the top of your chart for a license message. If it says "License: no token," open Tools > Strategicflows License, paste your license token, click Save token and then Check now.
How many PCs can I run Strategic Flows on?
Your license token is good for 2 PCs. For example, you can run Strategic Flows on your main trading computer and on a laptop as a backup. Each activation is linked to that computer's NinjaTrader Machine ID, which is shown in the StrategicFlows License Manager.
You manage your own license, so you don't need to contact support to move it. If you get a new computer, or want to switch one of your activations to a different PC, you can do it yourself in the License Manager:
- On the computer you're moving away from, open NinjaTrader 8 and go to Tools > Strategicflows License.
- Click Release (this computer). This removes the license from that PC and frees up one of your two activations.
- On the new computer, install the License Add-On and Strategic Flows, then go to Tools > Strategicflows License.
- Paste your license token into the License token field and click Save token.
- Click Check now to confirm the license is active. The Status line will show the result.
That's it. Your license is now active on the new computer. Just remember to release a PC before activating a third one, because the token only allows 2 computers at a time.
Do you offer a free trial?
We don't offer a free trial, but every purchase comes with our 30-Day Money-Back Guarantee. Use Strategic Flows on your own charts for 30 days. If it isn't right for you, email us for a full refund.
Do I need Level 2 data to run Strategic Flows?
No. Strategic Flows runs on standard Level 1 data. To show the footprint and signals on historical bars, you need to turn on Tick Replay in NinjaTrader 8.
What trading platform does Strategic Flows run on?
Strategic Flows runs on NinjaTrader 8, both the free and paid versions.
How do I get it?
Clicking on the order link will redirect you to our secure payment processor page for Stripe. Please allow 3-6 hours for your order to be processed (usually sooner). Your download links and license token arrive by email, with import instructions and the full User Guide.
What if I get stuck?
Email support and the plain-English guide have you covered. Every signal, every setting, explained with everyday examples.
You've watched candles long enough.
It's time to watch the fight.
GET STRATEGIC FLOWS NOW
All 3 bonuses are included with every order, whichever way you pay.
PAY WITH STRIPE →CREDIT OR DEBIT CARDOR
PayPal · PAY WITH PAYPAL →$499 one-time. All 3 bonuses included.
The green button checks out through Stripe (credit or debit card). The gold button checks out through PayPal.
Either way, please allow 3-6 hours for your order to be processed (usually sooner).
P.S. Still scrolling? Here's the short version: Strategic Flows is a complete order flow platform for NinjaTrader 8. It reads the raw trades, runs 77 signals built from 30 years on floors and institutional desks, and refuses to mark your chart until the evidence agrees. It's $499 one time ($1,997 retail), and today that includes Strategic Profile ($399), Strategic Notes ($299) and Strategic Screenshot ($299) free. Stop reading the words. Start reading the story.
P.P.S. The traders who lose with order flow software are the ones who turn everything on and drown. That's exactly why the Consensus engine, the Templates and the Cheat Sheet exist. You won't just own the signals. You'll know which ones agree, which ones overlap, and which combinations make a case. Nobody else hands you that.
Disclaimer and Risk Disclosure
CFTC Rule 4.41: Hypothetical or Simulated performance results have certain limitations, unlike an actual performance record, simulated results do not represent actual trading. Also, since the trades have not been executed, the results may have under-or-over compensated for the impact, if any, of certain market factors, such as lack of liquidity. Simulated trading programs in general are also subject to the fact that they are designed with the benefit of hindsight. No representation is being made that any account will or is likely to achieve profit or losses similar to those shown.
Disclaimer: This presentation is for educational and informational purposes only and should not be considered a solicitation to buy or sell a futures contract or make any other type of investment decision. Futures trading contains substantial risk and is not for every investor. An investor could potentially lose all or more than the initial investment. Risk capital is money that can be lost without jeopardizing ones financial security or life style. Only risk capital should be used for trading and only those with sufficient risk capital should consider trading. Past performance is not necessarily indicative of future results.
Risk Disclosure: Futures and forex trading contains substantial risk and is not for every investor. An investor could potentially lose all or more than the initial investment. Risk capital is money that can be lost without jeopardizing ones’ financial security or life style. Only risk capital should be used for trading and only those with sufficient risk capital should consider trading. Past performance is not necessarily indicative of future results.
Hypothetical Performance Disclosure: Hypothetical performance results have many inherent limitations, some of which are described below. No representation is being made that any account will or is likely to achieve profits or losses similar to those shown; in fact, there are frequently sharp differences between hypothetical performance results and the actual results subsequently achieved by any particular trading program. One of the limitations of hypothetical performance results is that they are generally prepared with the benefit of hindsight. In addition, hypothetical trading does not involve financial risk, and no hypothetical trading record can completely account for the impact of financial risk of actual trading. For example, the ability to withstand losses or to adhere to a particular trading program in spite of trading losses are material points which can also adversely affect actual trading results. There are numerous other factors related to the markets in general or to the implementation of any specific trading program which cannot be fully accounted for in the preparation of hypothetical performance results and all which can adversely affect trading results.
© 2026 Strategic Traders. All rights reserved. NinjaTrader® is a registered trademark of NinjaTrader Group, LLC. BloodHound is a product of Shark Indicators. No affiliation or endorsement is implied.